
Customers
Reports Dashboard - Customers
| Target release | 09/22/2022 |
| Document status | DRAFT |
| Document owner | [email protected] |
| Developer | [email protected], [email protected], [email protected] |
| QA | [email protected] |
🎯 Objective
| Objective |
|---|
| Access the Customer Directory section which allows me to view and manage customer details efficiently. |
| Strengthening Customer Relationships |
| Enhancing Customer Directory |
🤔 Assumptions
- The project assumes that there is an existing system or database that stores customer data, including personal information, card details, loyalty program data, statistics, activity logs, coupon and reward usage, and customer insights.
- It assumes that there is a secure and compliant way to store and transmit payment card information, adhering to relevant security standards and regulations (e.g., PCI DSS).
- Users accessing the system have appropriate permissions and authentication to view and manage customer data.
- The project assumes that there are no significant changes in the underlying technology stack during development.
🌟 Milestones
Create a visual road-map and help your team stay on track.
🗒️ Requirements
| Requirement | User Story |
|---|---|
| Mobile responsive | The user interface for both Customer Directory and Customer Insights must be fully responsive, ensuring a seamless and user-friendly experience on mobile devices, including smartphones and tablets. All features and functionalities should be accessible and usable on smaller screens. |
| Data completeness | The Customer Directory should display comprehensive customer information, including personal details, card information, loyalty program status, statistics, activity logs, and coupon & reward usage. Ensure that all customer data fields are populated accurately, and no critical information is missing. |
| Data security | Implement robust data security measures to protect customer data |
| Increased convenience | Implement a user-friendly search and filter functionality in the Customer Directory to easily locate specific customers. |
| Record keeping | Keep an activity log in the Customer Directory to record customer interactions and transactions. Include date and time stamps. |
⚡ API Integration
| Description | API |
|---|---|
| Request list of customers | GetCustomerReportRequest (SignalR) |
| Request customer summary report | GetCustomerSummaryReportRequest (SignalR) |
| Request customer status (New, returning, lost customer and visit frequency) | GetCustomerStatusReportRequest (SignalR) |
| Request customer information detail | GetCustomerInformationRequest (SignalR) |
| Request list of customer credit cards | ListCreditCardByCustomerRequest (SignalR) |
| Request customer statistic | GetStatisticByCustomerRequest (SignalR) |
| Request customer sale behavior | GetSaleBehaviorByCustomerRequest (SignalR) |
| Request customer sale activities | ListSaleActivitiesByCustomerRequest (SignalR) |
| Request customer top sale items | ListTopSaleItemByCustomerRequest (SignalR) |
| Request update customer info | UpdateCustomerRequest (SignalR) |
| Request update customer credit cards | UpdateCustomerCreditCardRequest (SignalR) |
| Send Receipt via Email | /BLogicLicenseApi/api/utils/send-email-receipt (License
API) |
🎨 User interaction and design
To access Customer report - Customer Directory, go to Customers on the side menu bar
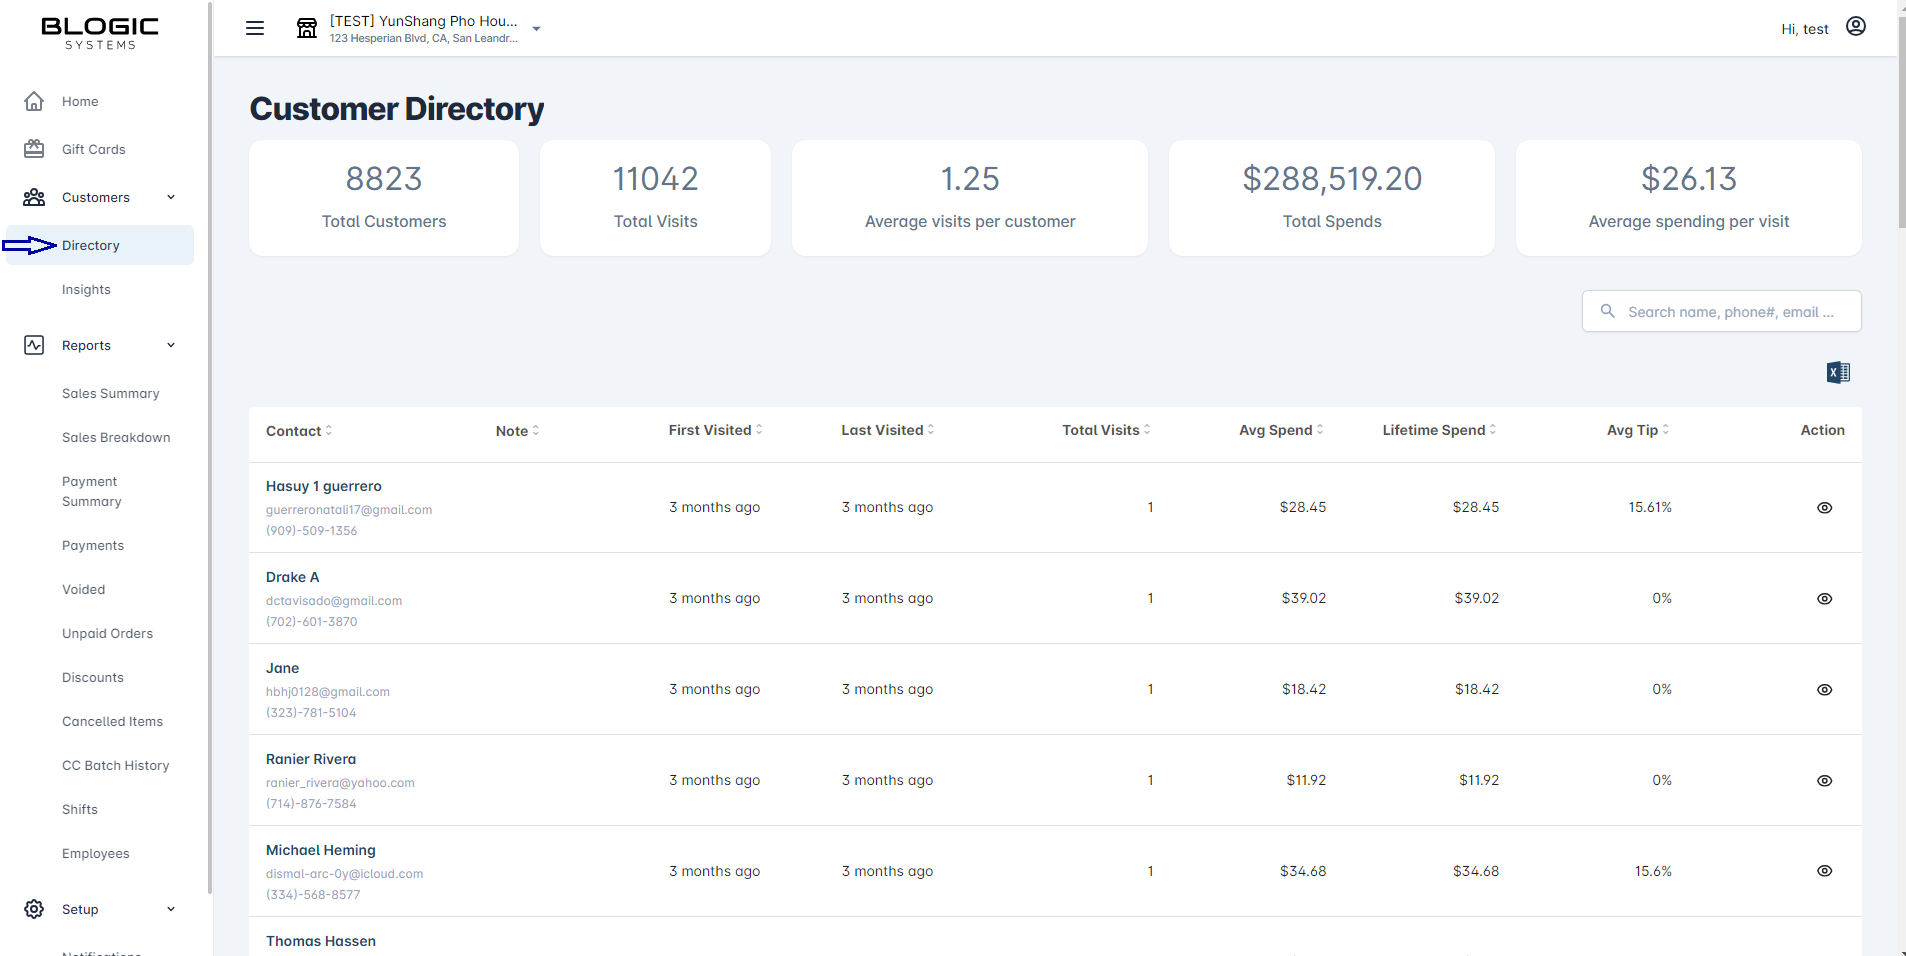
We have 2 sections
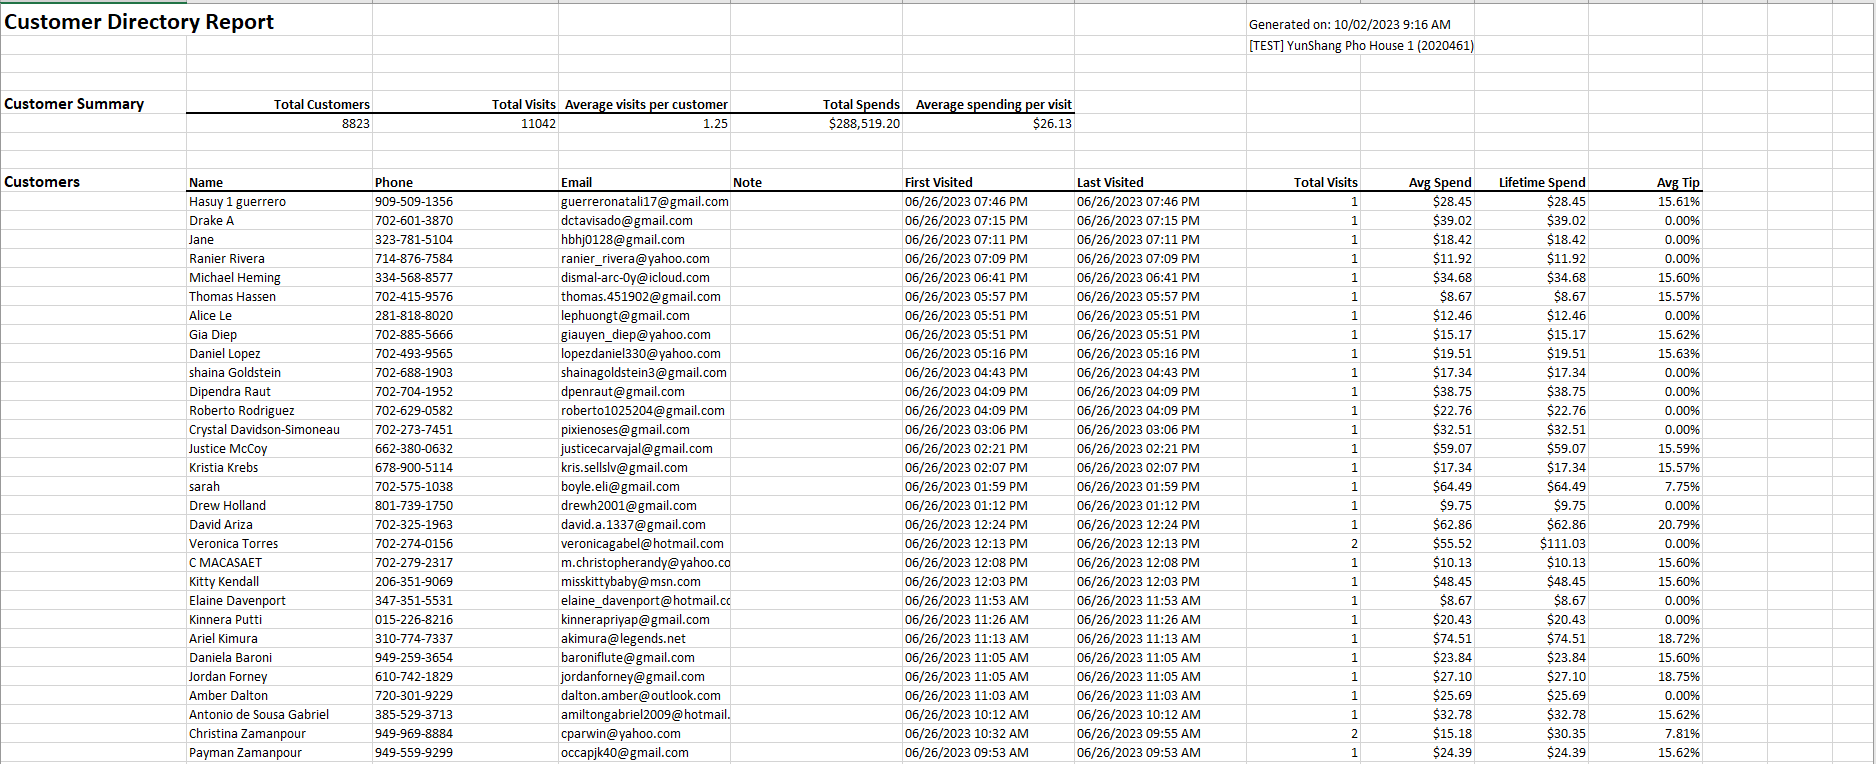
The summary section includes the following metrics: - Total Customers: The total number of customers, including customers who created from POS dashboard/POS (with/without successful transaction) or created from a succesful transaction from different order types and mandatory customer phone number inputted. + Transaction with Deposit Item is still recorded into customer list , howerver, data of First/Last Visited, Total Visits, Avg Spend, Lifetime Spend, Avg Tip are not counted. - Total Visits: The total number of customers who have successfully transaction. - Average visits per customer: The average number of visits per customer (Total Visits / Total Customers). - Total Spends: The total amount spent by each transaction (not inluding custom fee & tip) - Average spending per visit: The average amount spent by each customer per visit (Total Spend of all Customers / Total Visits).
The second section is a list of customers.
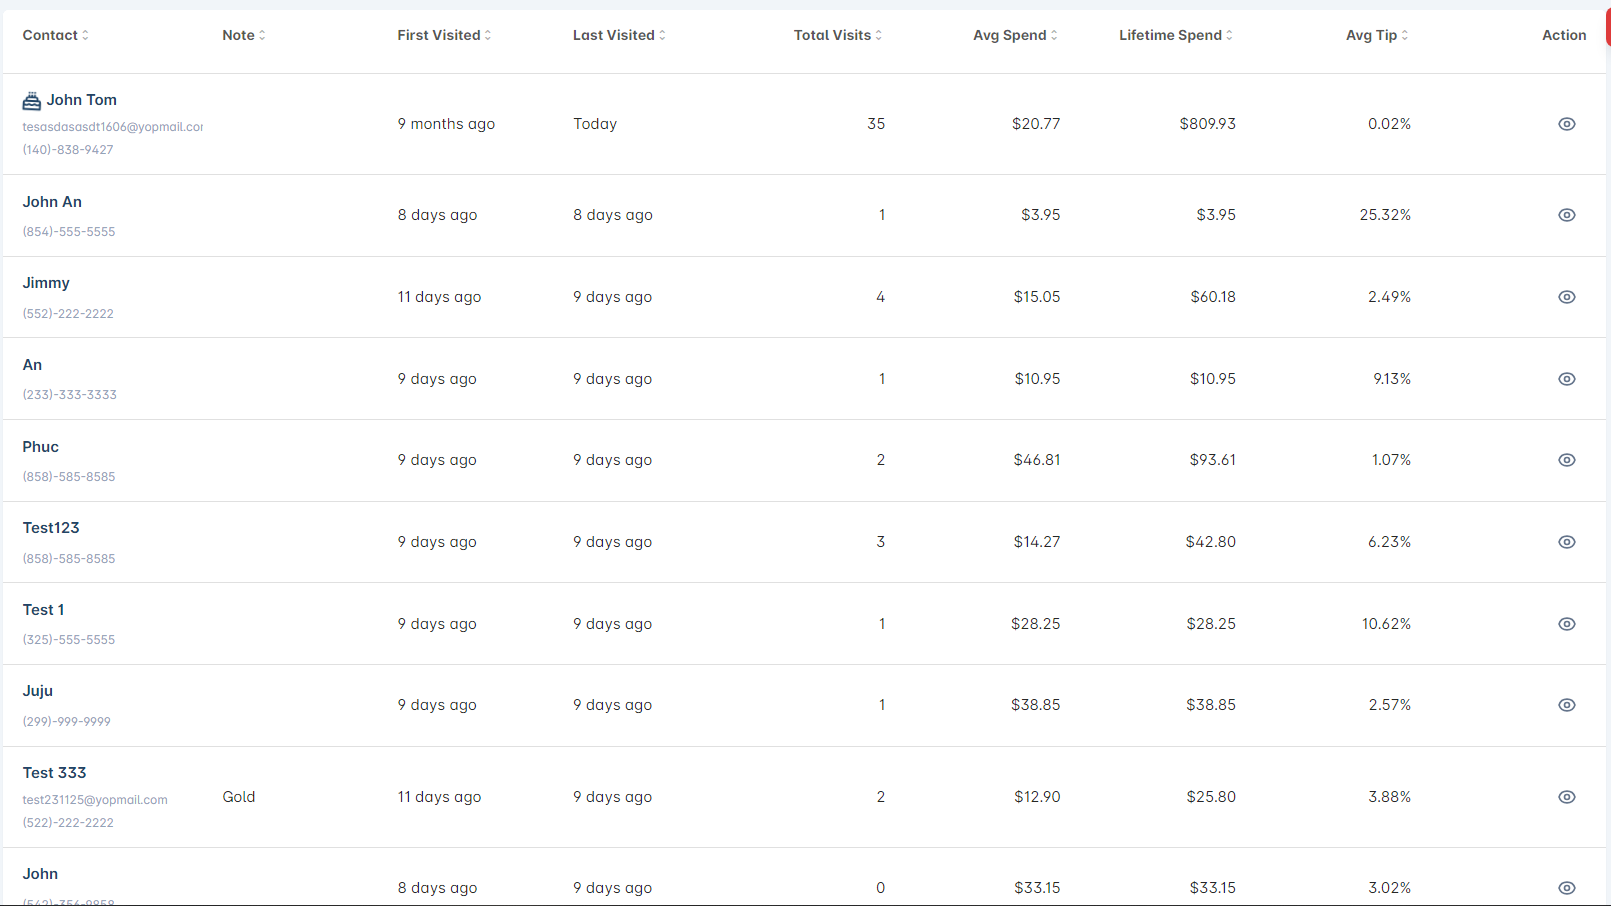
We have a table displaying information for all customers:
- Contact: Basic personal information (Name, email, and phone number)
- Note: Notes about the customer
- ****First** Visited:** The date of the customer’s first visit to the store with a successful transaction
- Last Visited: The most recent date the customer visited the store and had a successful transaction
- Total Visits: The total number of visits to the store by the customer with successful transactions
- Avg Spend: The average amount spent by the customer on each visit to the store (Lifetime Spend / Total Visits)
- Lifetime Spend: The total amount of money the customer has spent with up to date (Not including Custom Fee & Tip)
- Avg Tip: The average tip given by the customer on each store visit (((Total Tips / Lifetime Spend) / Total Visits) * 100)) - A customer record is displayed in the list right after a new customer is created successfully from POS dashboard or from POS (when making a new order). At this time, First Visited & Last Visited columns display blank, all remaining columns are displayed 0 (except Note and Action column)
🎂 On their birthday, an icon will be displayed to help the store owner notice that customer and offer special deals. {.is-info}
We can also export all customer information to Excel.
Customer Detail Info
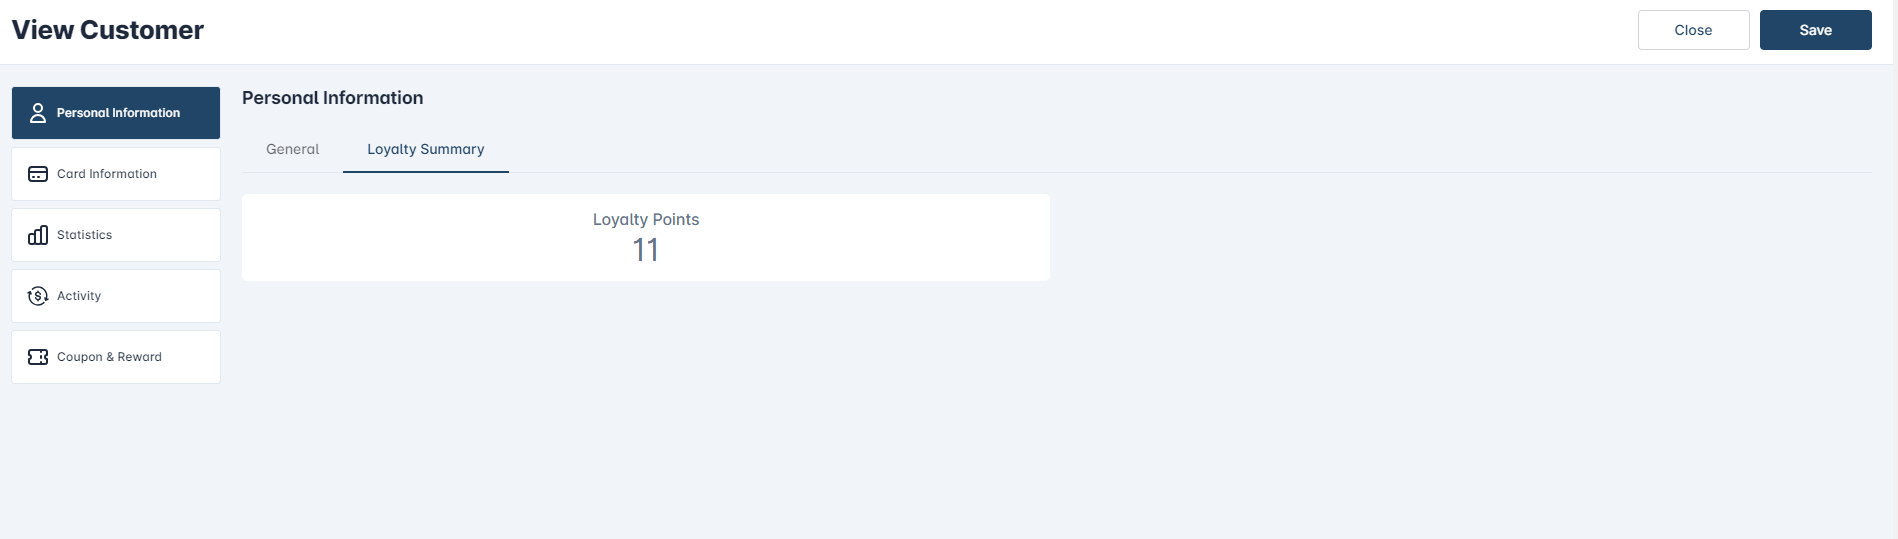
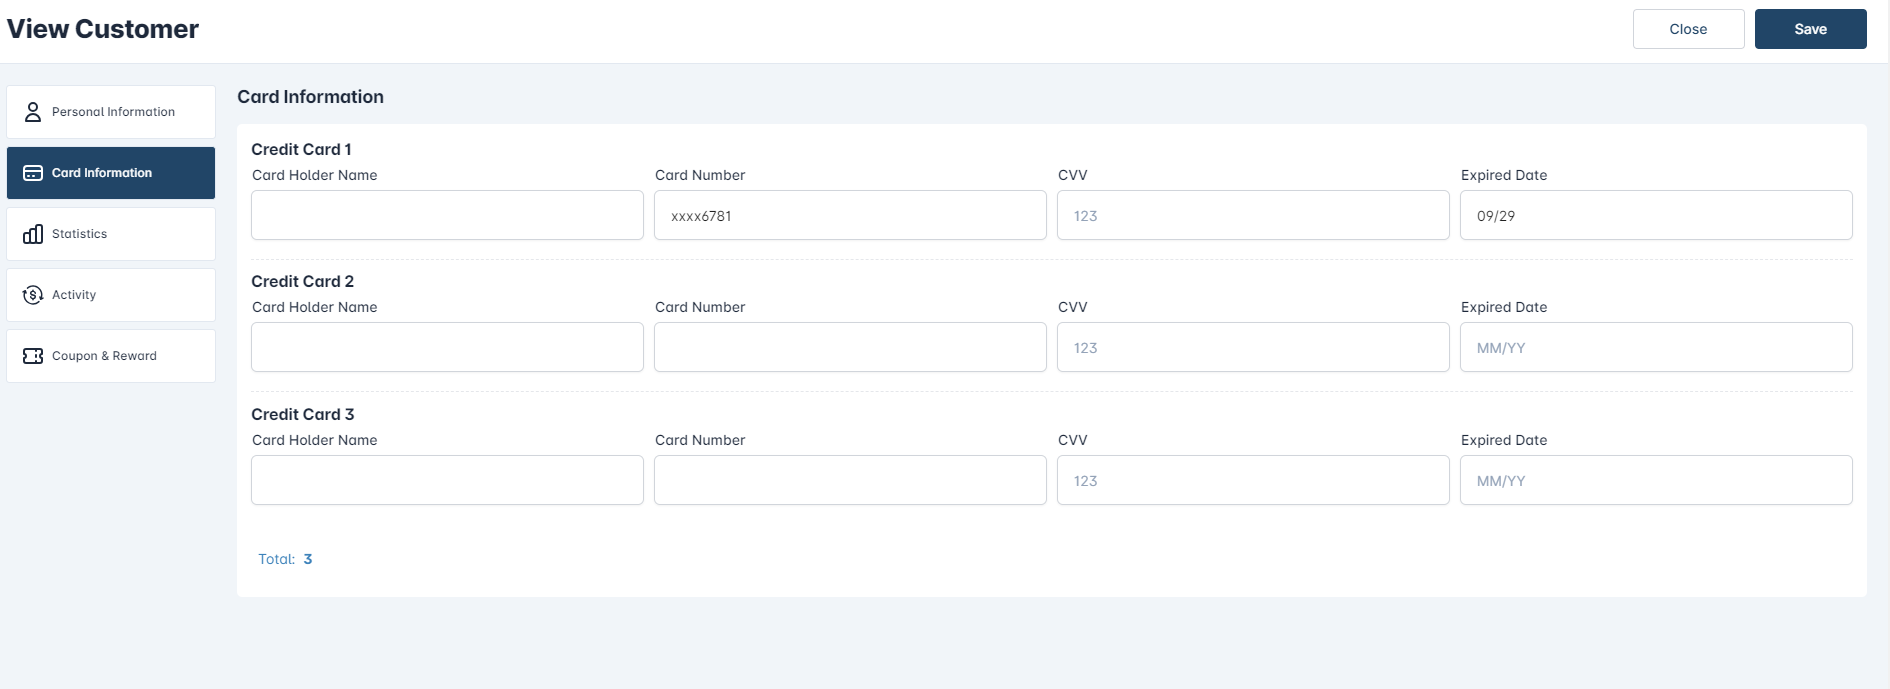
- Personal Information: Including 2 tabs:
- General: Customer’s personal details.
- Loyalty Summary: Overview of the customer’s loyalty points.
- Card Information: Information about customer payment cards used in the store.
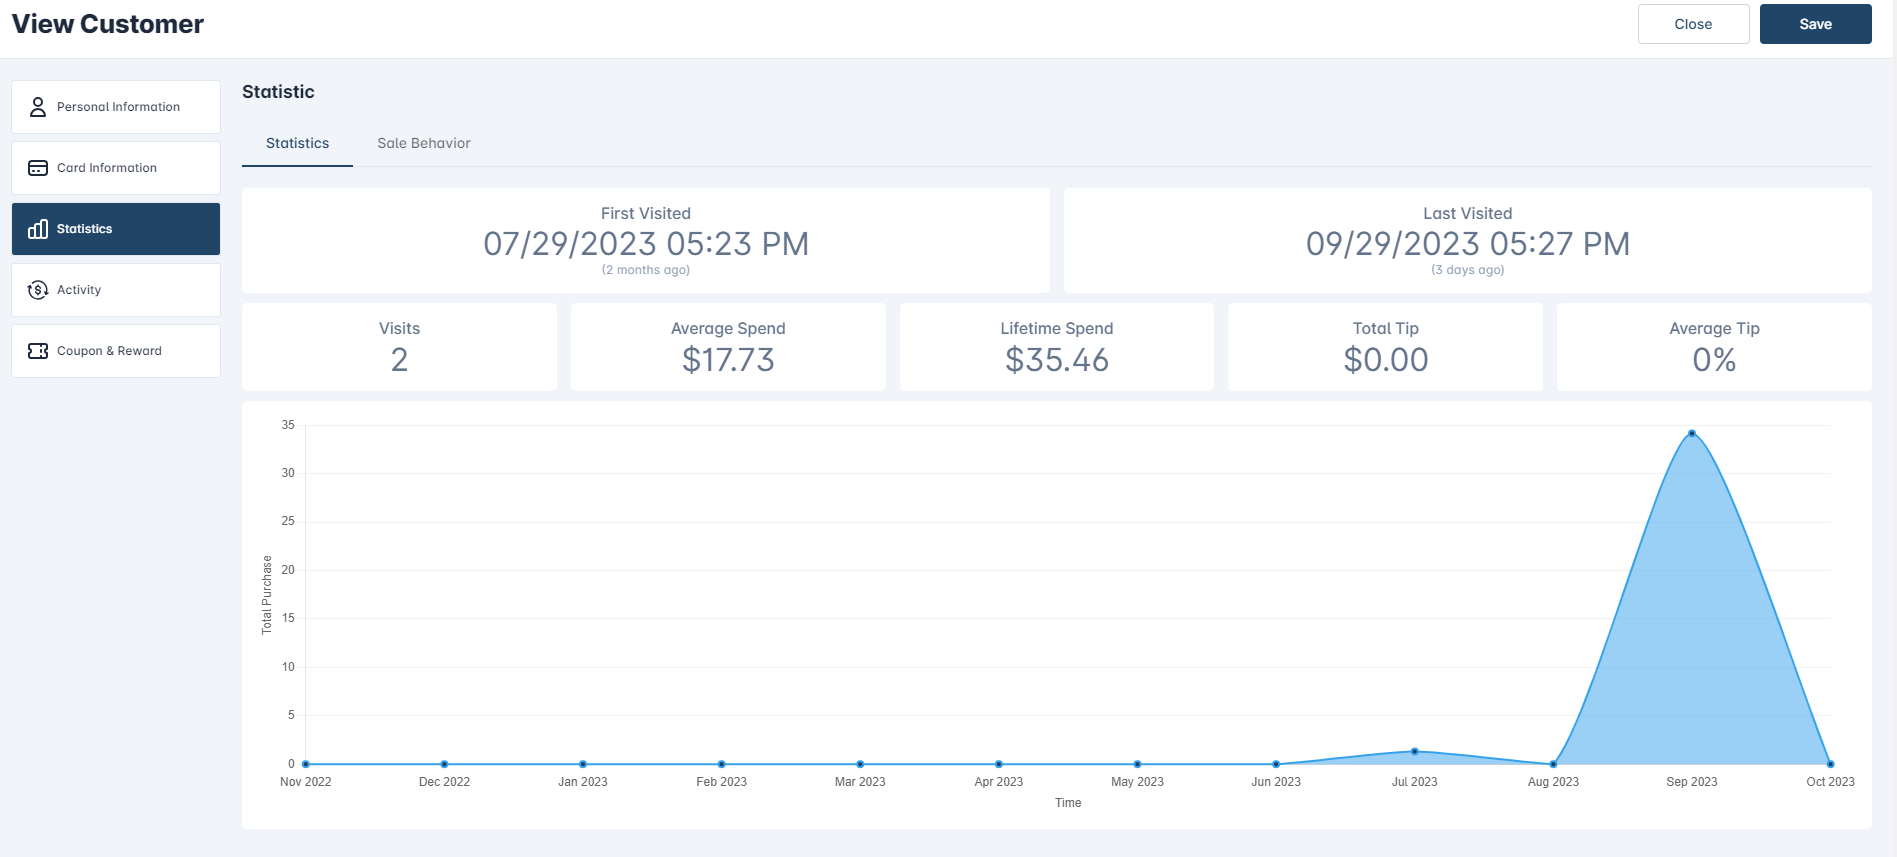
- Statistics: Purchase activity and buying behavior information.
- Activity: Transaction history at the store.
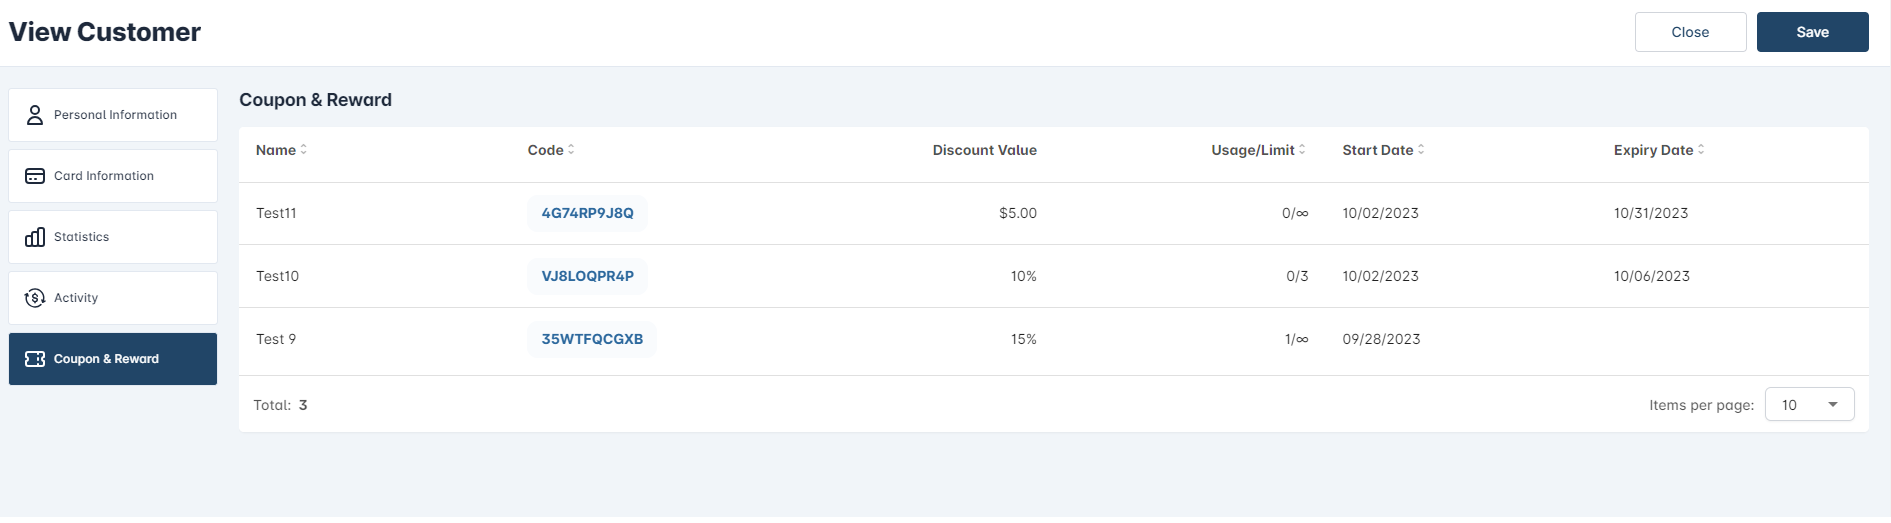
- Coupons & Rewards: Information about relevant coupons and rewards.
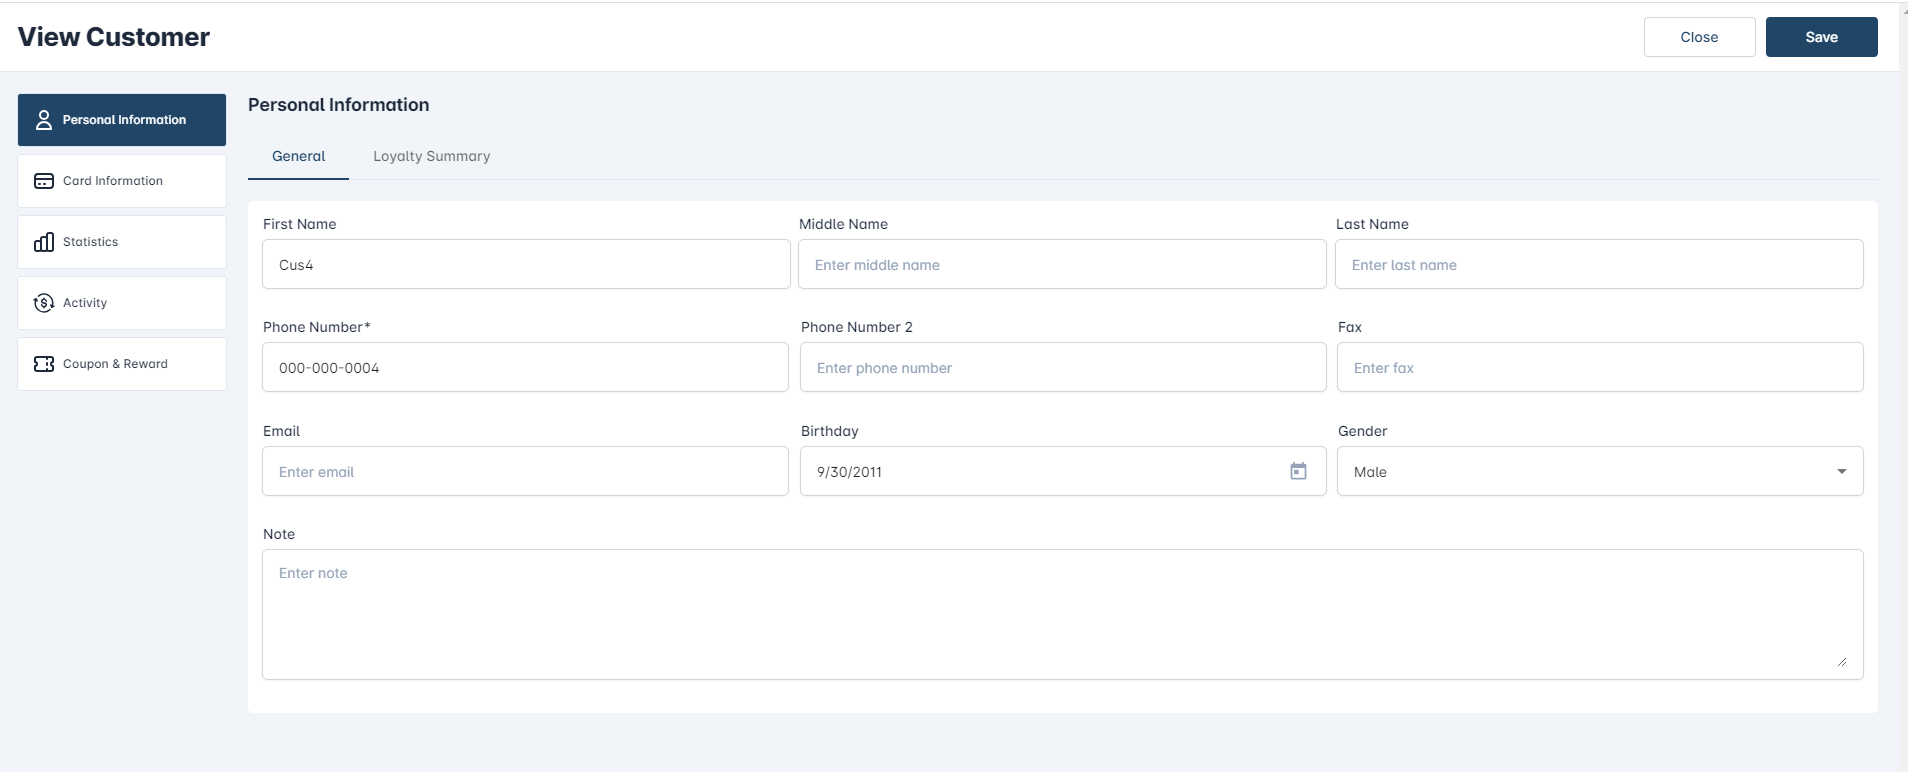
Personal Information - General In this section, we display the personal information of the customer. We can edit this information, with the ‘Phone Number’ field being a required field.
- Loyalty Summary This is the section displaying the customer’s loyalty points (The remaining accumulated points).
Card Information Include information about the customer’s credit cards. Each card will have fields for card holder name, card number, CVV, and expiration date.
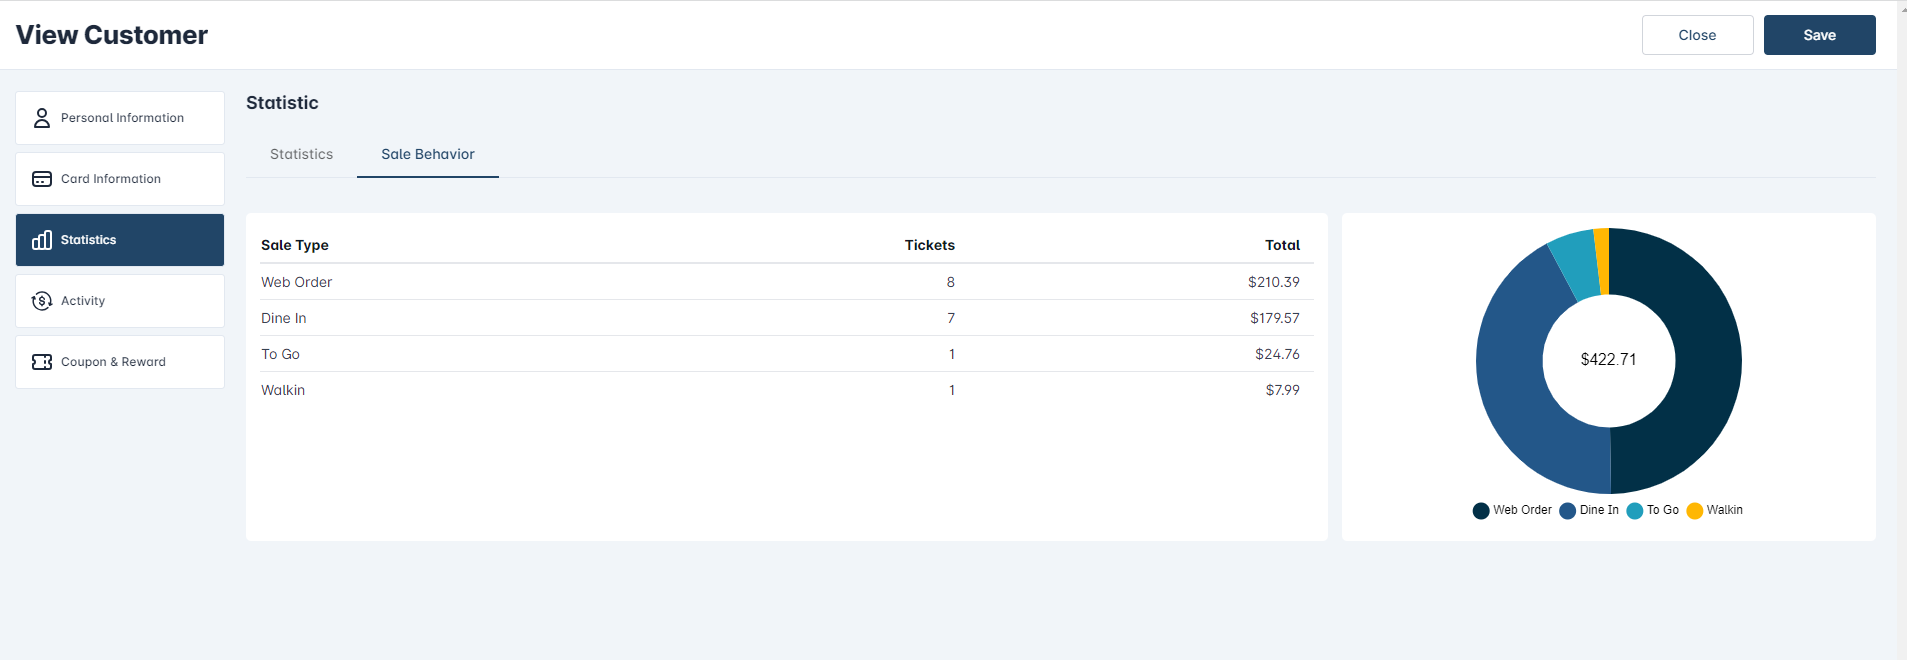
Statistics This is the section that summarizes the customer’s shopping behavior, comprising two parts: Statistics and Sale Behavior. - Statistics: An overview of the customer’s shopping history to date. - Sale Behavior: Analysis of the customer’s shopping behavior. (Do not show any information related to Deposit Item in 2 tabs)
Statistics
We have items displaying customer statistics as follows:
- First Visited: The date of the customer’s first visit to the store with a successful transaction.
- Last Visited: The most recent date the customer visited the store and had a successful transaction.
- Visits: The total number of visits to the store by the customer with successful transactions.
- Avg Spend: The average amount spent by the customer on each visit to the store (Lifetime Spend / Total Visits). - Lifetime Spend: The total amount of money the customer has spent with up to date. (Not including Custom Fee & Tip) - Total Tip: The total amount of tips the customer has given us to date.
- Avg Tip: The average tip given by the customer on each store visit (((Total Tips / Lifetime Spend) / Total Visits) * 100)).
And we have a chart depicting the amount of money spent by the customer in each month (from the current month back to 12 months ago).
Sale Behavior
This section displays statistics on the customer’s shopping habits, including how they make purchases and place orders using various methods (Togo, Delivery, Web Order, Phone Order, Pos Express, Kiosk, …).
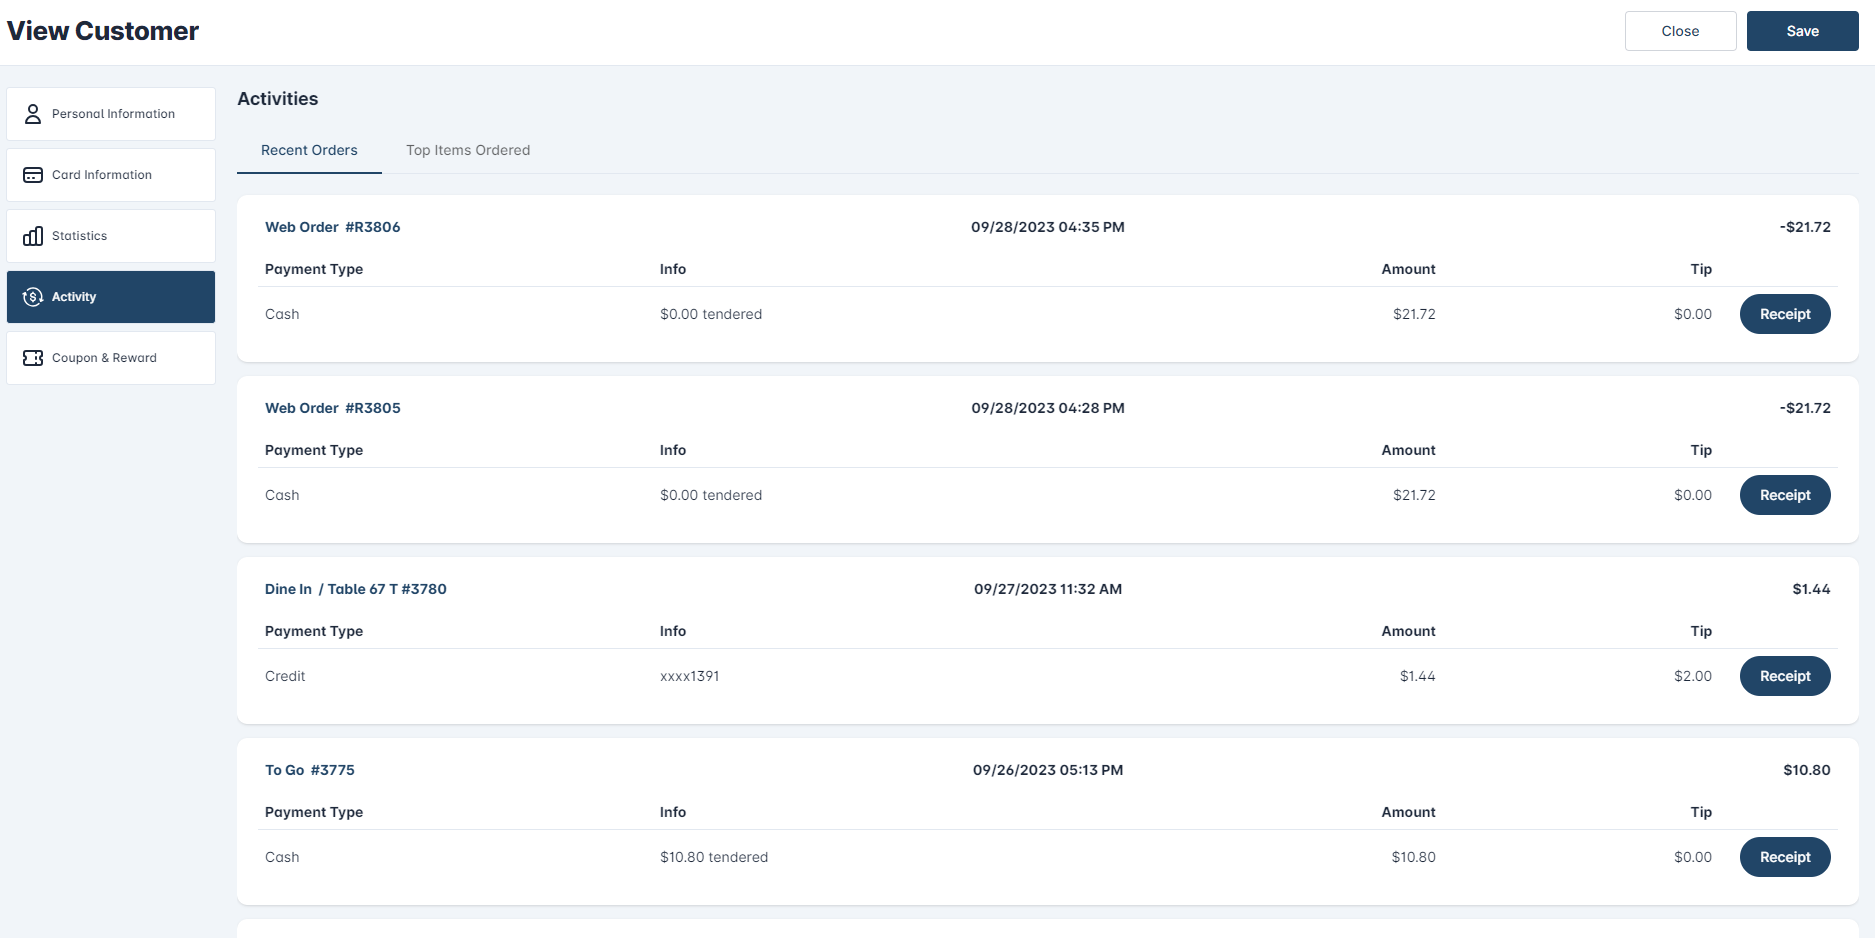
Activity
This section displays the customer’s purchase history and provides statistics on which products they have purchased.
(Do not show any information of Deposit Item related to 2 tabs, will implement 2 more tabs about Void and Deposit Item)
Recent Orders Item displayed in an transaction
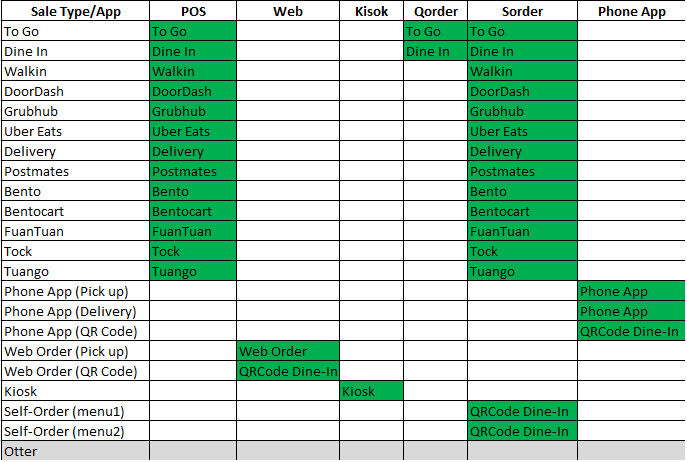
+ Sale Type: Display as in below table.
+ Ticket ID: as in sale receipt
+ Date time of a transaction: as in sale receipt
+ Payment Type: Cash/Credit Card/Gift/Deposit/…
+ Info: Display Card info if payment by Credit Card/Gift. Display amount if payment by Cash
+ Amount: Display the amount as in Final Total in sale receipt (Include Subtotal + SVC + Tax + Custom fee) + Tip: Display tip amount. + Total Amount (in the upper right corner): Amount + Tip
Sale Type table
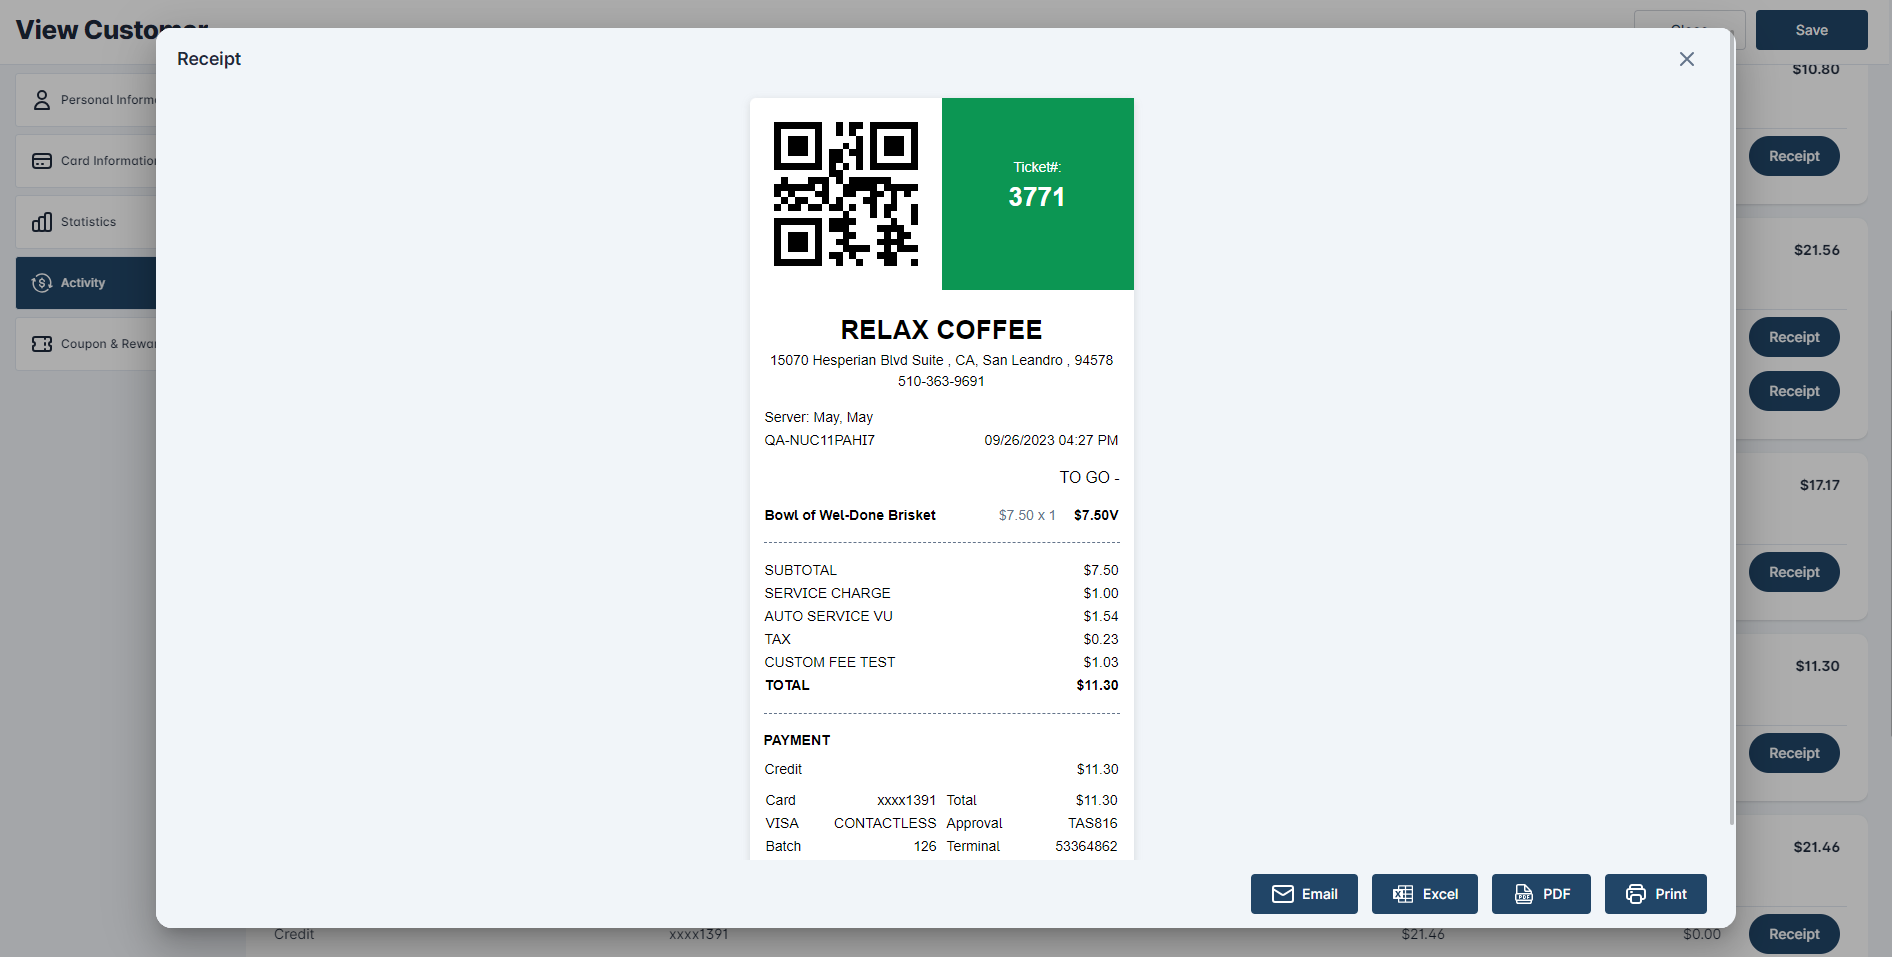
We can view the receipt for each ticket.
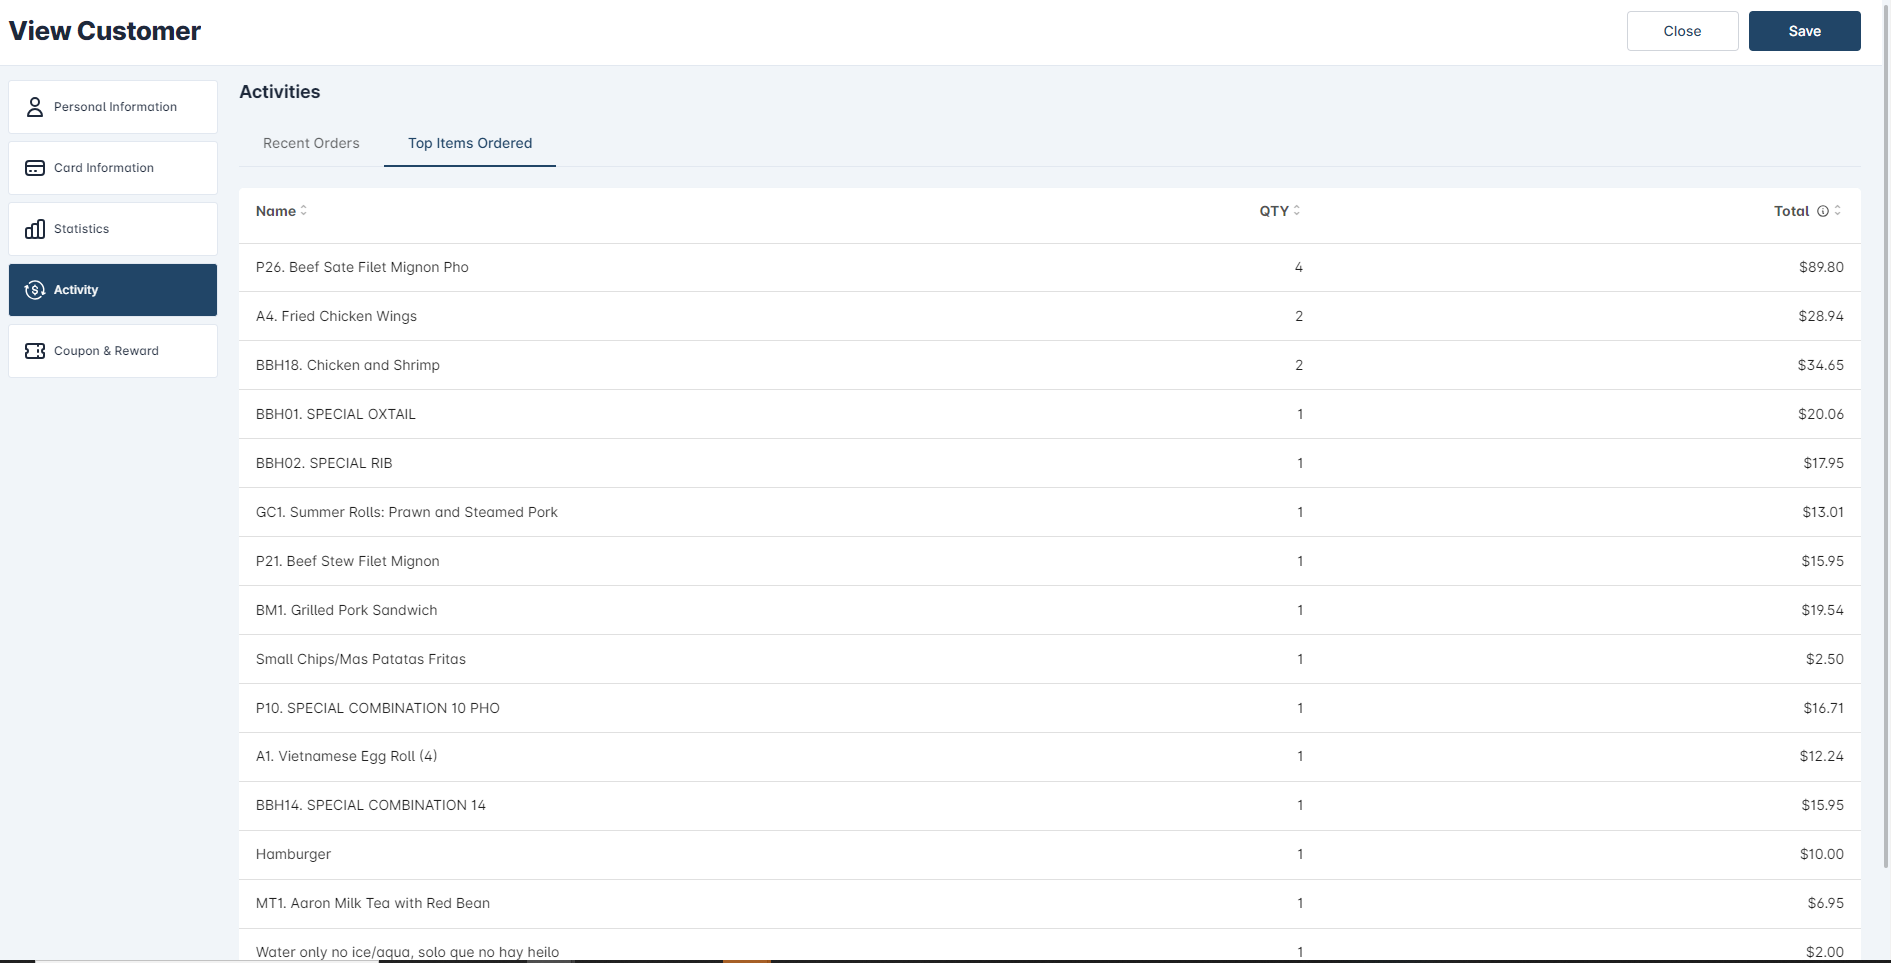
Top Items Ordered
The list of items for the customer is sorted by default in descending order based on the corresponding amount spent on each item.
Coupons & Rewards
This section displays a list of store coupons that meet the following conditions: the coupon has been published, it still has available usage quantities, and it has not yet expired.
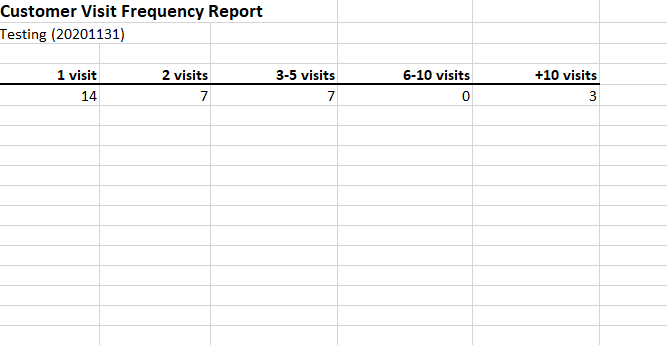
Customer Insights
- Customer Insights can help you better understand your customers’ behaviors through their payments.
- The Visit by New vs. Returning Customer Performance shows your Total Visits and sales breakdown by new vs. returning customers over the specified time period.
- The Lost Customers shows the number of customers whose last purchase occurred at least 2 months before the start of the current period.
- The Customer Visit Frequency graph displays the frequency of your customer visits over a specific time period.
The New vs. Returning Customer
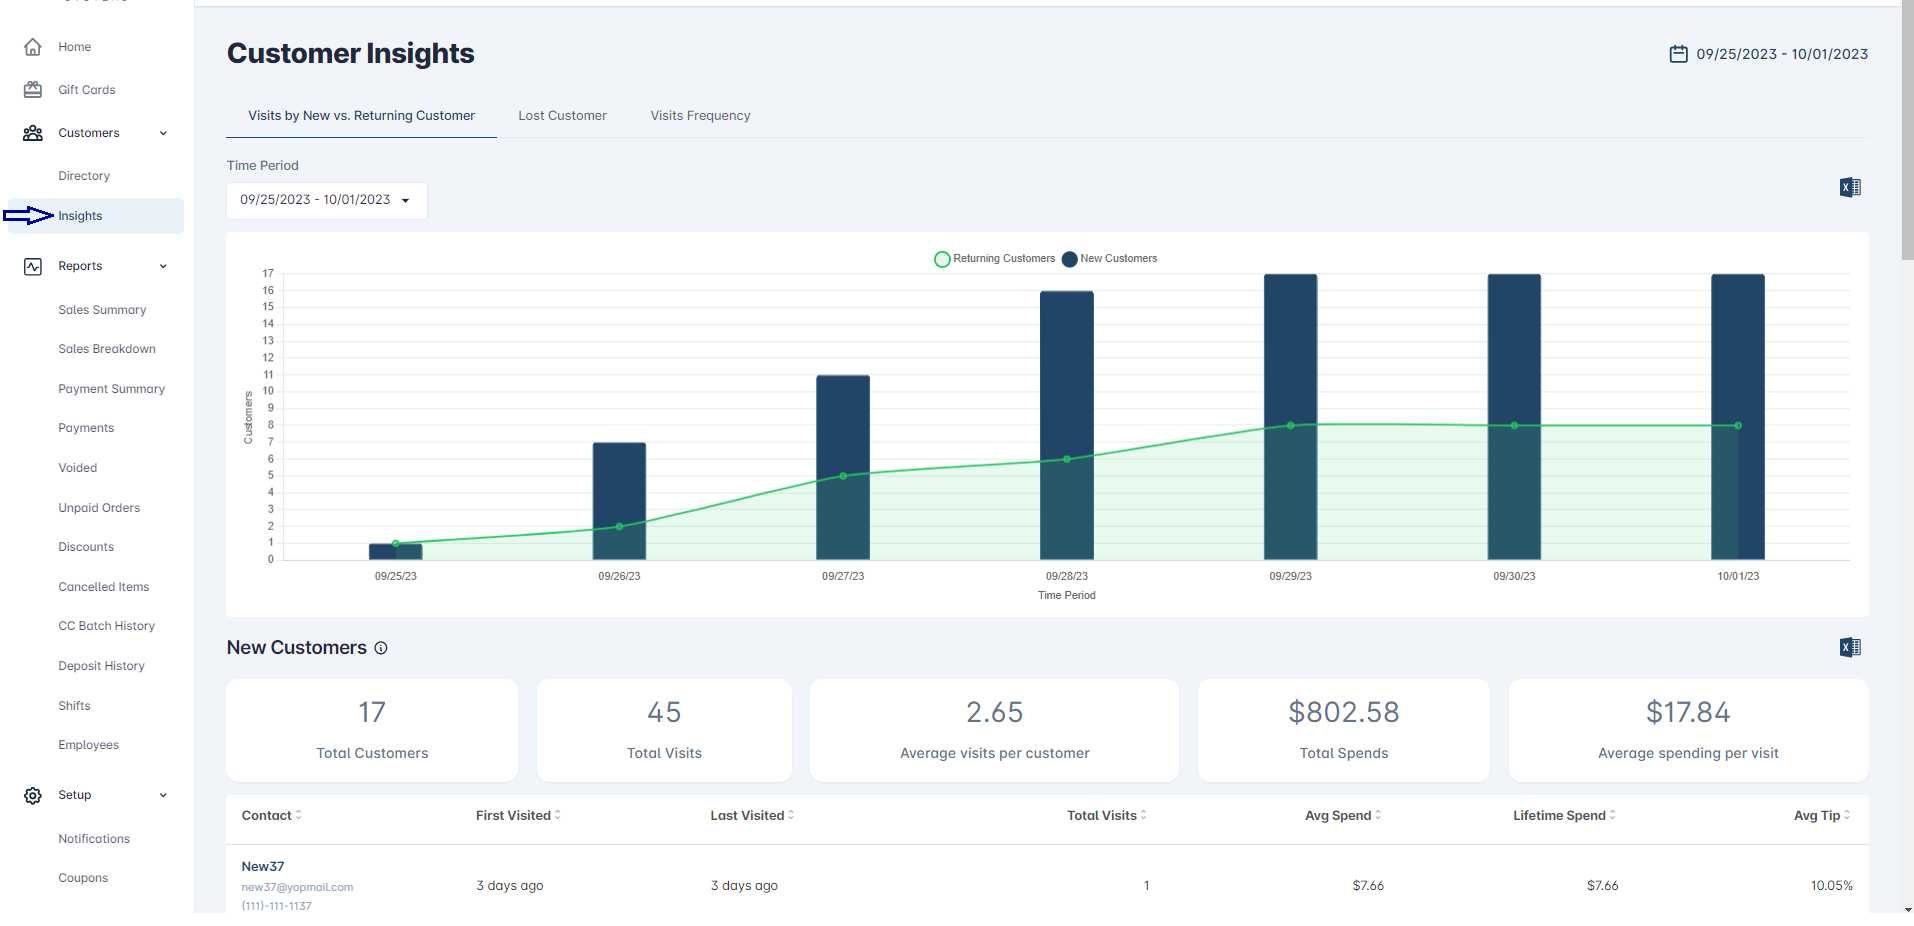
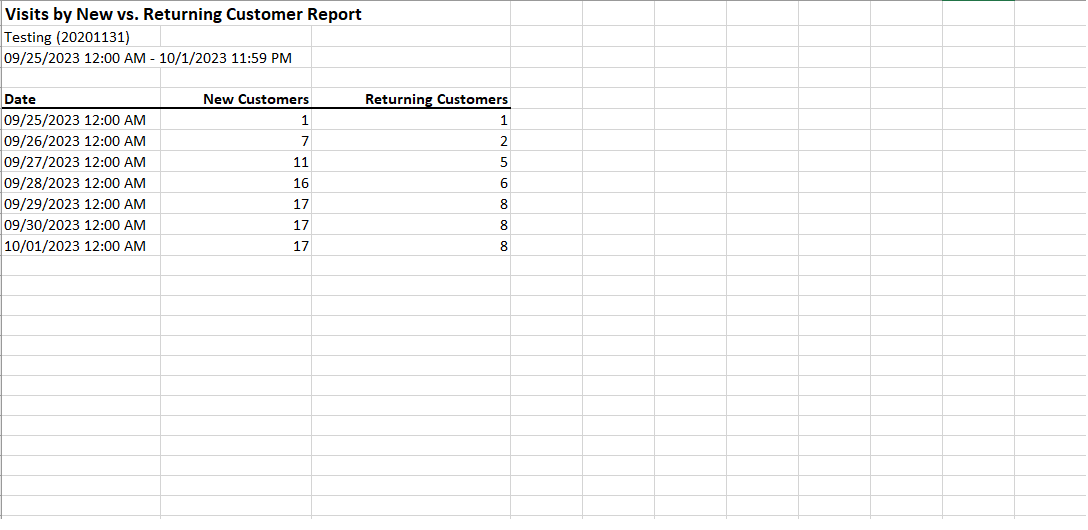
The Chart: show the number of New vs. Returning customer over the specified time period Chart về New Customer - Đối với time period là “Today”: So sánh data của ngày hiện tại với ngày hôm trước. - Đối với time period là Tuần, Tháng, Quarter, Year: So sánh data của tuần đó với tuần trước, tháng đó với tháng trước, quý đó với quý trước, năm đó với năm trước. + Nếu trong time period Tuần mà có 1 new customer và có transaction ở các ngày thì tính theo time period Tuần vẫn gọi là 1 New Customer + Tương tự với Month/Quarter/Year
    Ví dụ:
+ Ngày 25/9: Có 1 new customer
+ Ngày 26/9: Có 6 new customer
+ Ngày 27/9: Có 4 new customer
+ Ngày 28/9: Có 5 new customer
+ Ngày 29/9: Có 1 new customer
Chọn time period Last week (09/25/2023 - 10/01/2023]
Chart sẽ hiển thị data như sau:
+ Ngày 25/9: Show 1 new customer
+ Ngày 26/9: Show 7 new customer
+ Ngày 27/9: Show 11 new customer
+ Ngày 28/9: Show 16 new customer
+ Ngày 29/9: Show 17 new customer
(Xem hình ảnh ở ngay trên)
Chart về Returning Customer
- Đối với time period là “Today”: So sánh data của ngày hiện tại với ngày hôm trước.
- Đối với time period là Tuần, Tháng, Quarter, Year: So sánh data của tuần đó với tuần trước, tháng đó với tháng trước, quý đó với quý trước, năm đó với năm trước.
+ Nếu trong time period Tuần mà có 1 returning customer và có transaction ở các ngày khác thì tính theo time period Tuần vẫn gọi là 1 returning customer. + Tương tự với Tháng/Quarter/Năm
💡 We use the period filter to select the appropriate timeframes. {.is-info}
We can export chart to Excel.
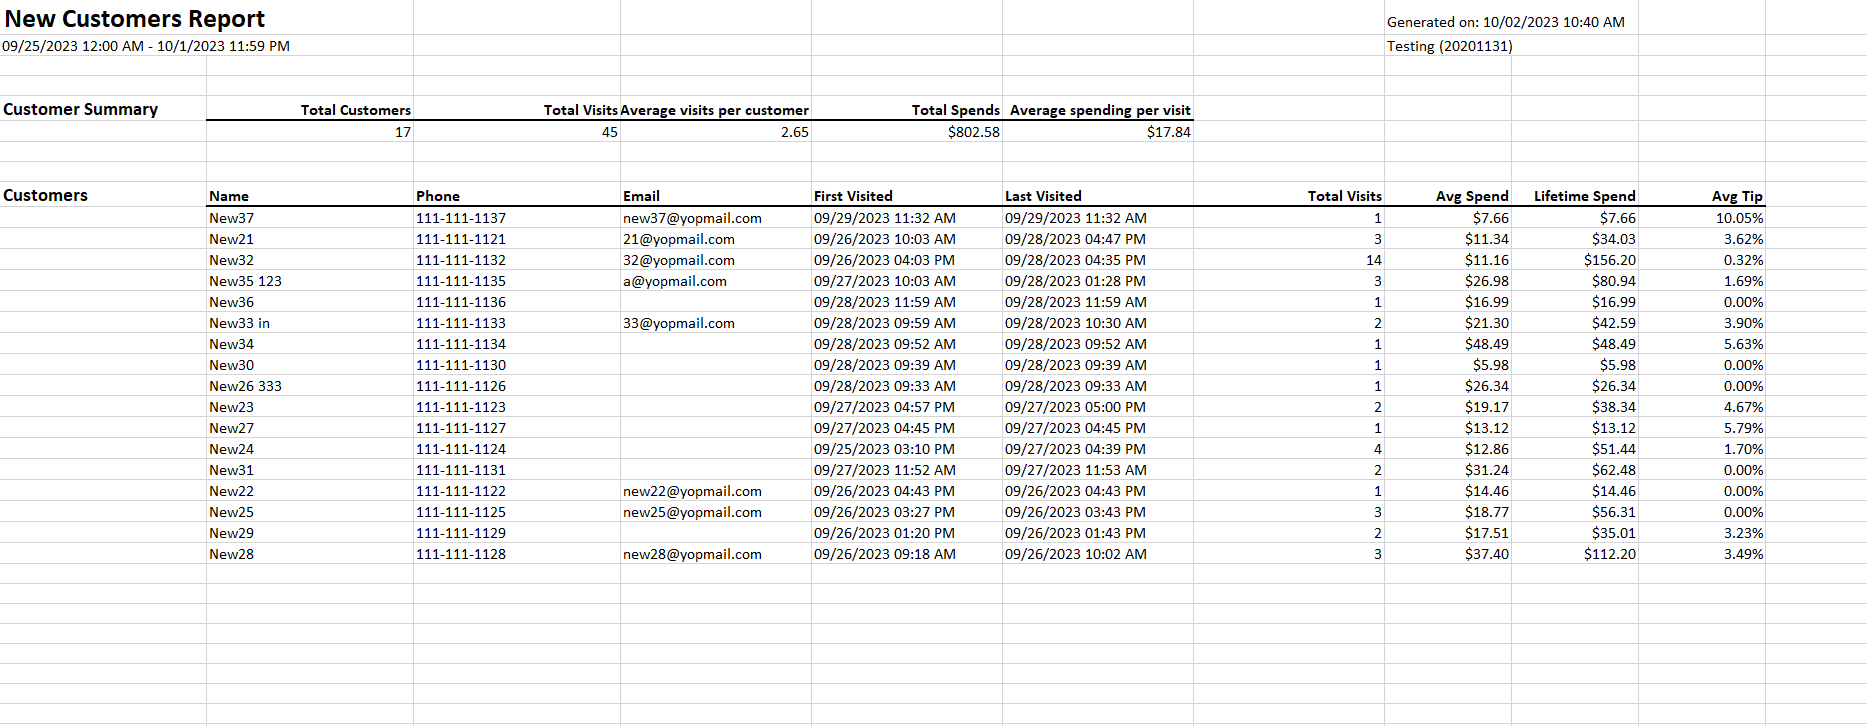
New customers: the number of customers who made their first purchase within that time period. We also have 2 sections as Customer Directory
- The summary section includes the following metrics:
- Total Customers: The total number of customers with successful transaction counted within specified time period.
- Total Visits: The total number of customers who have successful transaction counted within specified time period.
- Average visits per customer: The average number of visits per customer (Total Visits / Total Customers).
- Total Spends: The total amount spent by each transaction (not inluding custom fee & tip) counted within specified time period.
- Average spending per visit: The average amount spent by each customer per visit (Total Spend of all Customers / Total Visits).
- The second section is a list of customers. We have a table displaying information for all customers:
- Contact: Basic personal information (Name, email, and phone number).
- First Visited: The date of the customer’s first visit to the store with a successful transaction.
- Last Visited: The most recent date the customer visited the store and had a successful transaction.
- Total Visits: The total number of visits to the store by the customer with successful transactions within specified time period.
- Avg Spend: The average amount spent by the customer on each visit to the store (Lifetime Spend / Total Visits) within specified time period.
- Lifetime Spend: The total amount of money the customer has spent within specified time period.
- Avg Tip: The average tip given by the customer on each store visit (((Total Tips / Lifetime Spend) / Total Visits) * 100)) within specified time period.
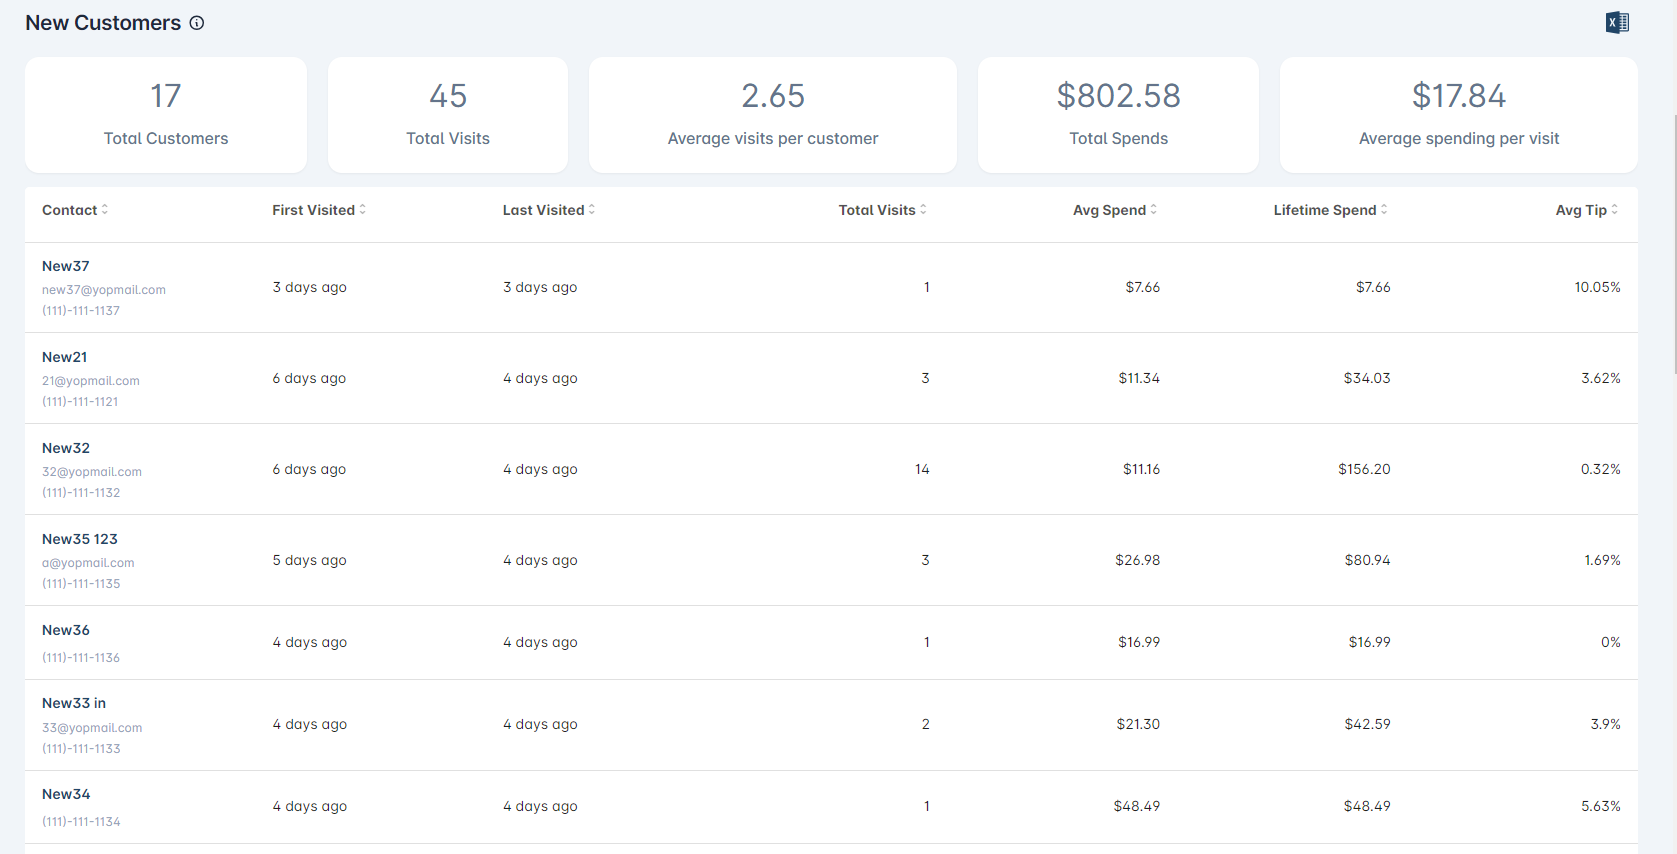
We can also export to excel the list of New customer over selected time period
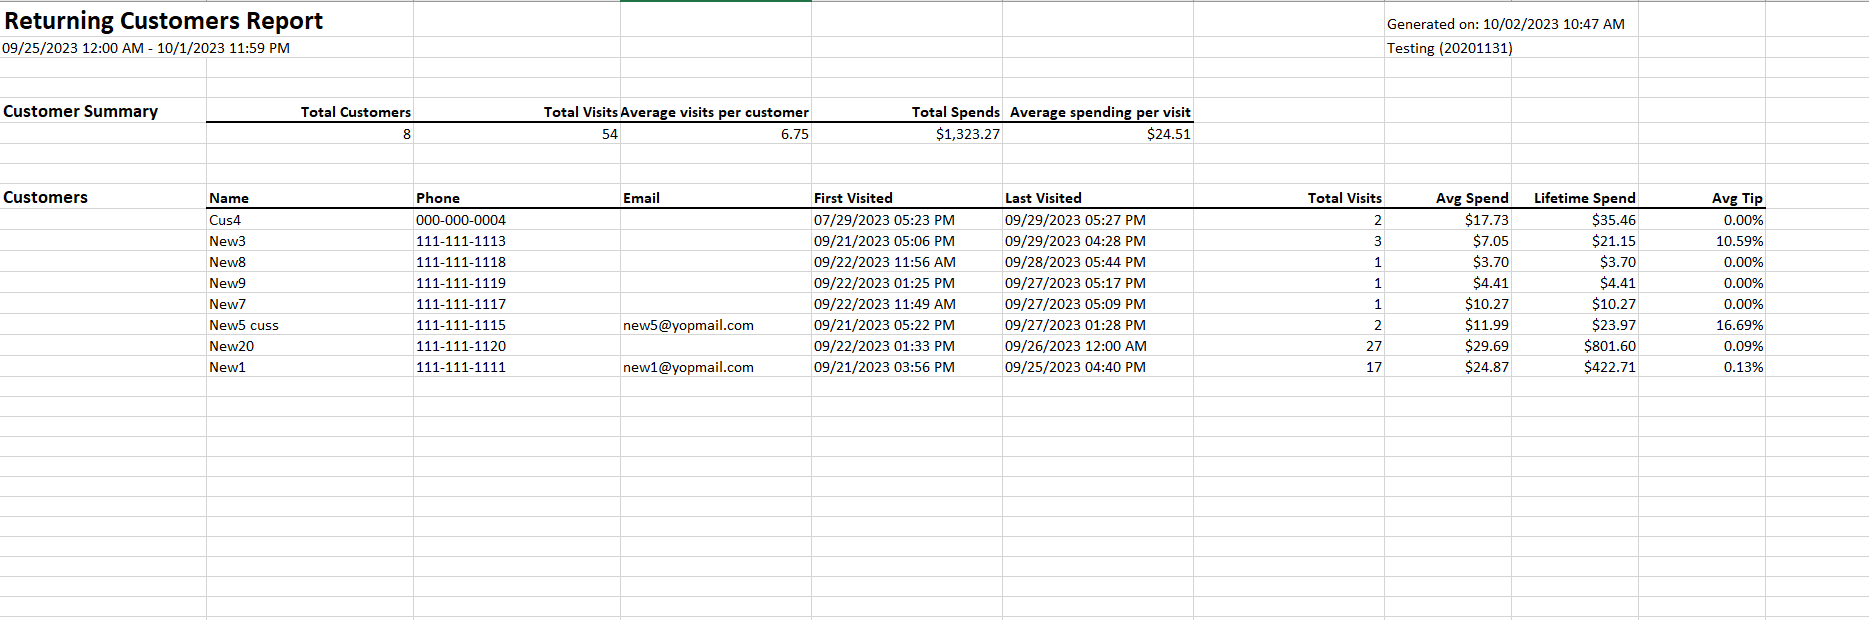
Returning customers: the number of customers who have already purchased something in the past, and are returning in that time period.
We also have 2 sections as Customer Directory
- The summary section includes the following metrics:
- Total Customers: The total number of customers with successful transaction counted from the 1st visit until specified time period.
- Total Visits: The total number of customers who have successful transaction counted from the 1st visit until specified time period.
- Average visits per customer: The average number of visits per customer (Total Visits / Total Customers) counted from the 1st visit until specified time period.
- Total Spends: The total amount spent by each transaction (not inluding custom fee & tip) counted from the 1st visit until specified time period.
- Average spending per visit: The average amount spent by each customer per visit (Total Spend of all Customers / Total Visits) counted from the 1st visit until specified time period.
- The second section is a list of customers. We have a table displaying information for all customers:
- Contact: Basic personal information (Name, email, and phone number).
- First Visited: The date of the customer’s first visit to the store with a successful transaction.
- Last Visited: The most recent date the customer visited the store and had a successful transaction.
- Total Visits: The total number of visits to the store by the customer with successful transactions counted from the 1st visit until specified time period.
- Avg Spend: The average amount spent by the customer on each visit to the store (Lifetime Spend / Total Visits) counted from the 1st visit until specified time period.
- Lifetime Spend: The total amount of money the customer has spent counted from the 1st visit until specified time period. (Not including Custom Fee & Tip)
- Avg Tip: The average tip given by the customer on each store visit (((Total Tips / Lifetime Spend) / Total Visits) * 100)) counted from the 1st visit until specified time period.
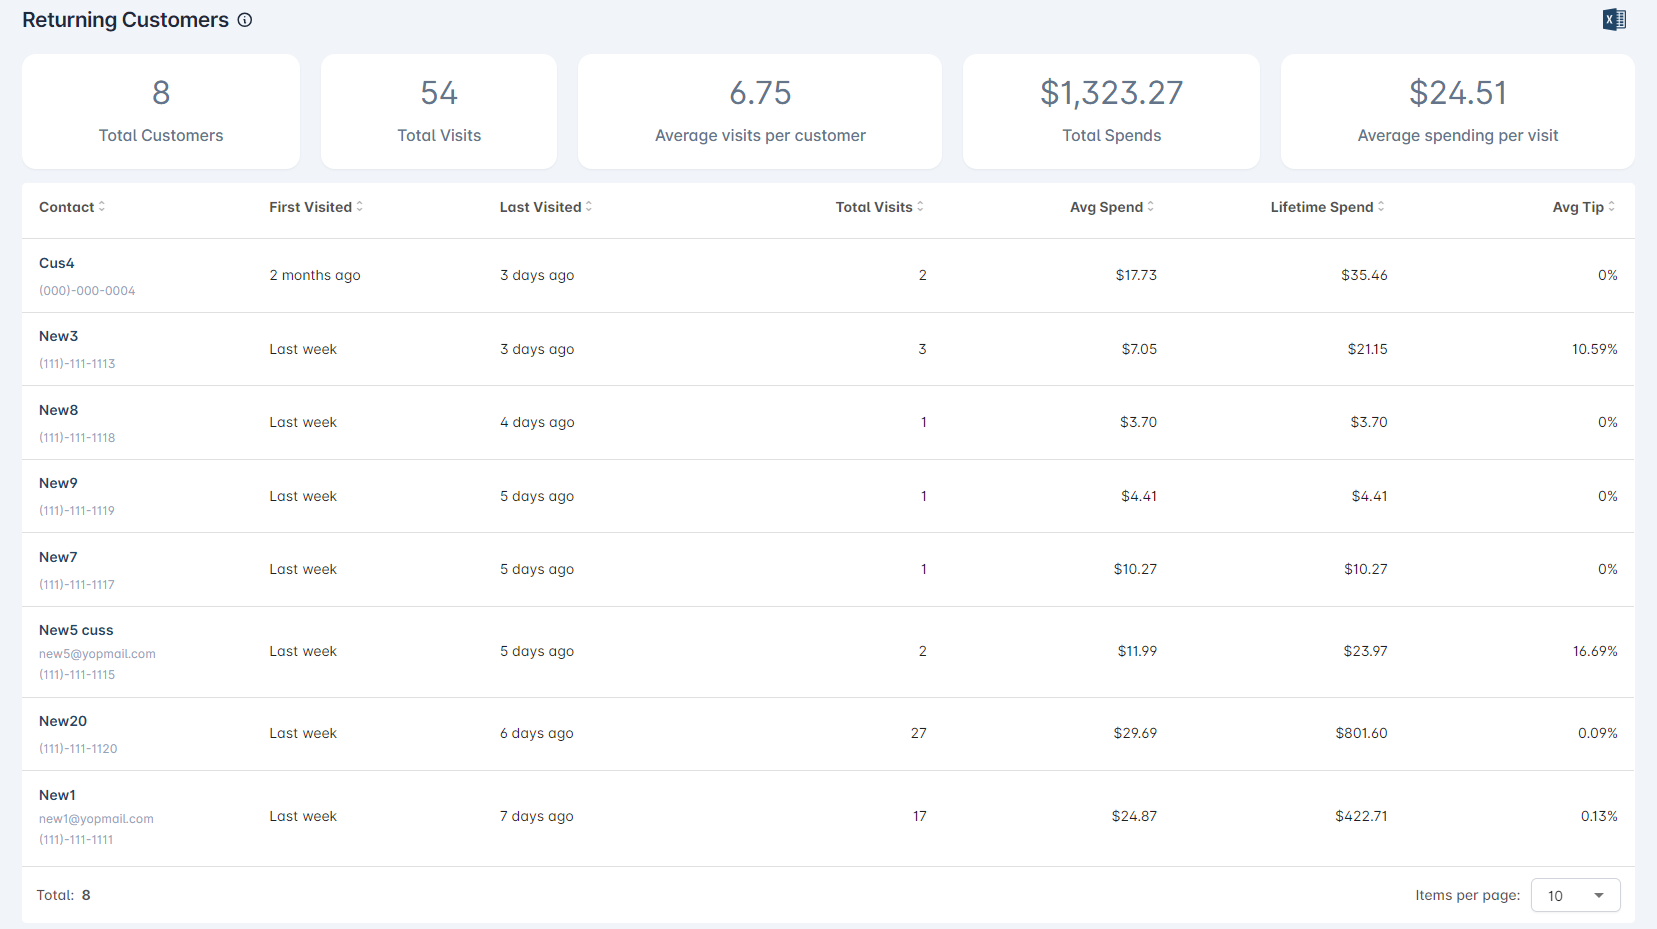
We can also export to excel the list of Returning customer over selected time period
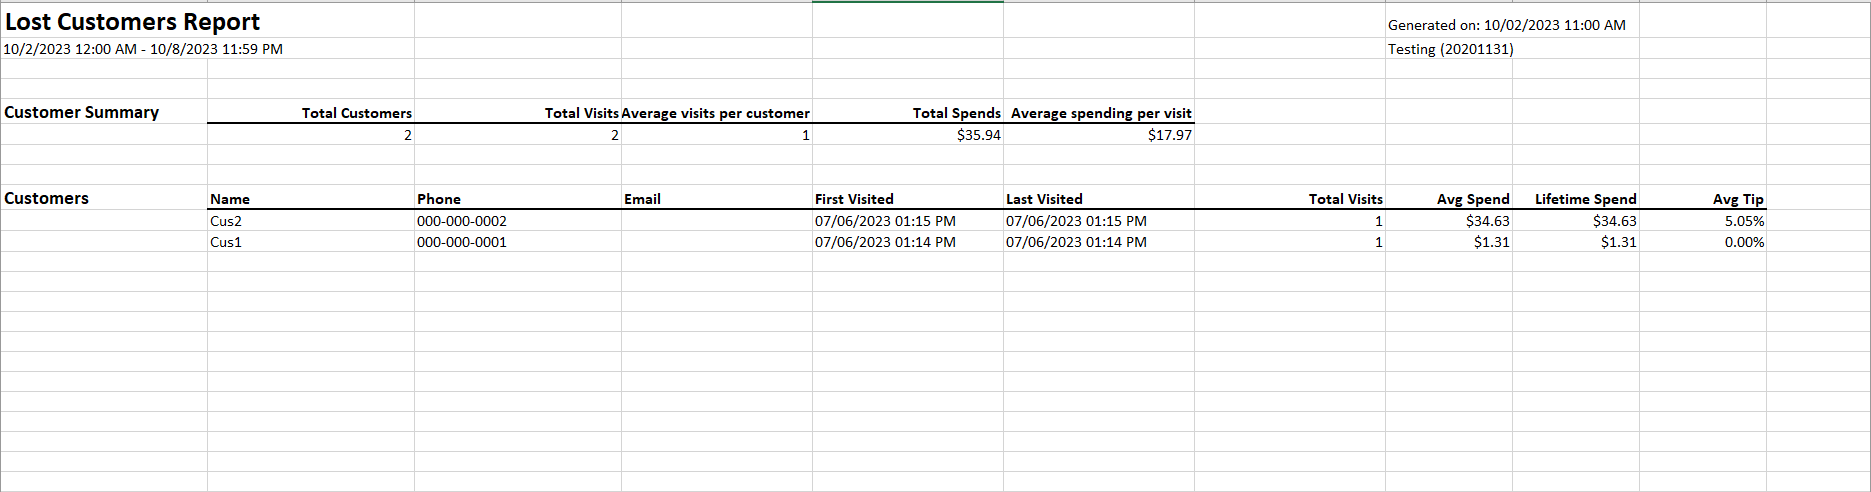
Lost Customer Shows the number of customers whose last purchase occurred at least 2 months before the start of the current period.
We have 3 sections.
- The Chart: show the number of customers who haven’t had any transaction at least 2 months from the 1st transaction until over the specified time period
- Chart hiển thị ở các time period: so sánh ngày trong chart với ngày có transaction lần đầu tiên.
- Với các time period là tháng: Luôn tính cuối tháng là thời điểm baseline data.
- The summary section includes the following metrics:
- Total Customers: The total number of customers who haven’t had any transaction at least 2 months from the 1st transaction until the specified time period
- Total Visits: The total number of lost customers who have successful transaction counted from the 1st visit until specified time period.
- Average visits per customer: The average number of visits per lost customer (Total Visits / Total Customers) counted from the 1st visit until specified time period.
- Total Spends: The total amount spent by each transaction (not inluding custom fee & tip) counted from the 1st visit until specified time period.
- Average spending per visit: The average amount spent by each lost customer per visit (Total Spend of all Customers / Total Visits) counted from the 1st visit until specified time period.
- The 3rd section is a list of lost customers. We have a table displaying information for all customers:
- Contact: Basic personal information (Name, email, and phone number).
- First Visited: The date of the lost customer’s first visit to the store with a successful transaction.
- Last Visited: The most recent date the lost customer visited the store and had a successful transaction.
- Total Visits: The total number of visits to the store by the lost customer with successful transactions counted from the 1st visit until specified time period.
- Avg Spend: The average amount spent by the lost customer on each visit to the store (Lifetime Spend / Total Visits) counted from the 1st visit until specified time period.
- Lifetime Spend: The total amount of money the lost customer has spent counted from the 1st visit until specified time period. (Not including Custom Fee & Tip)
- Avg Tip: The average tip given by the lost customer on each store visit (((Total Tips / Lifetime Spend) / Total Visits) * 100)) counted from the 1st visit until specified time period.
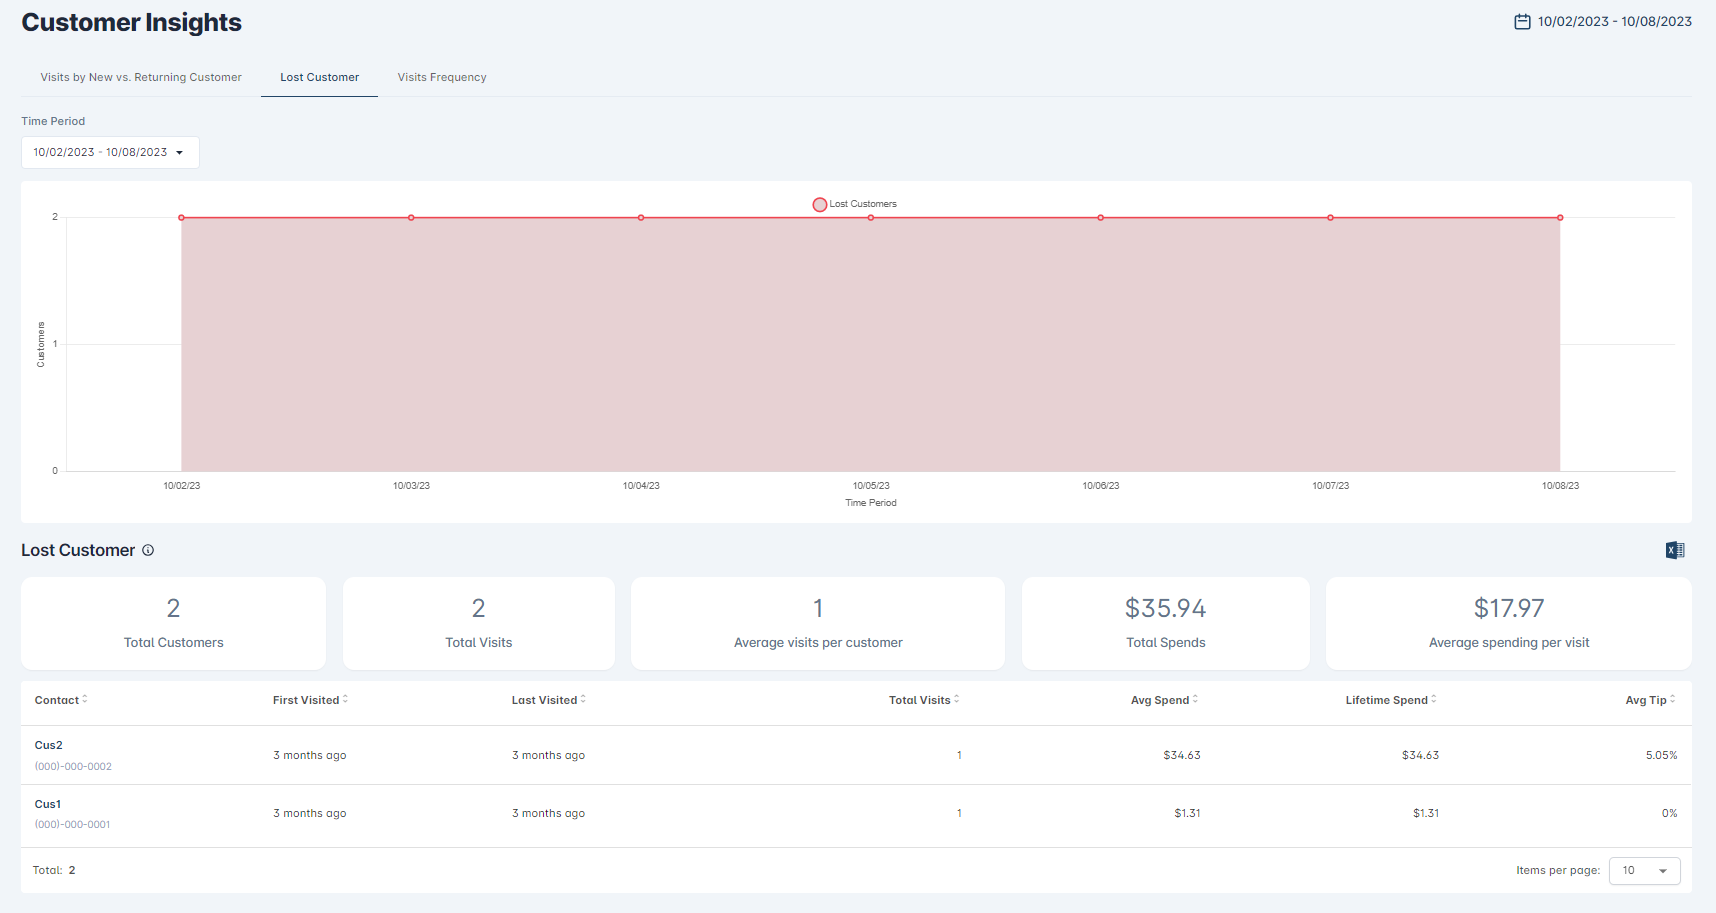
We can export chart to Excel.
Visits Frequency
Use this chart to better understand your distribution of customers by visit count, which is a good indicator of overall customer loyalty and retention.
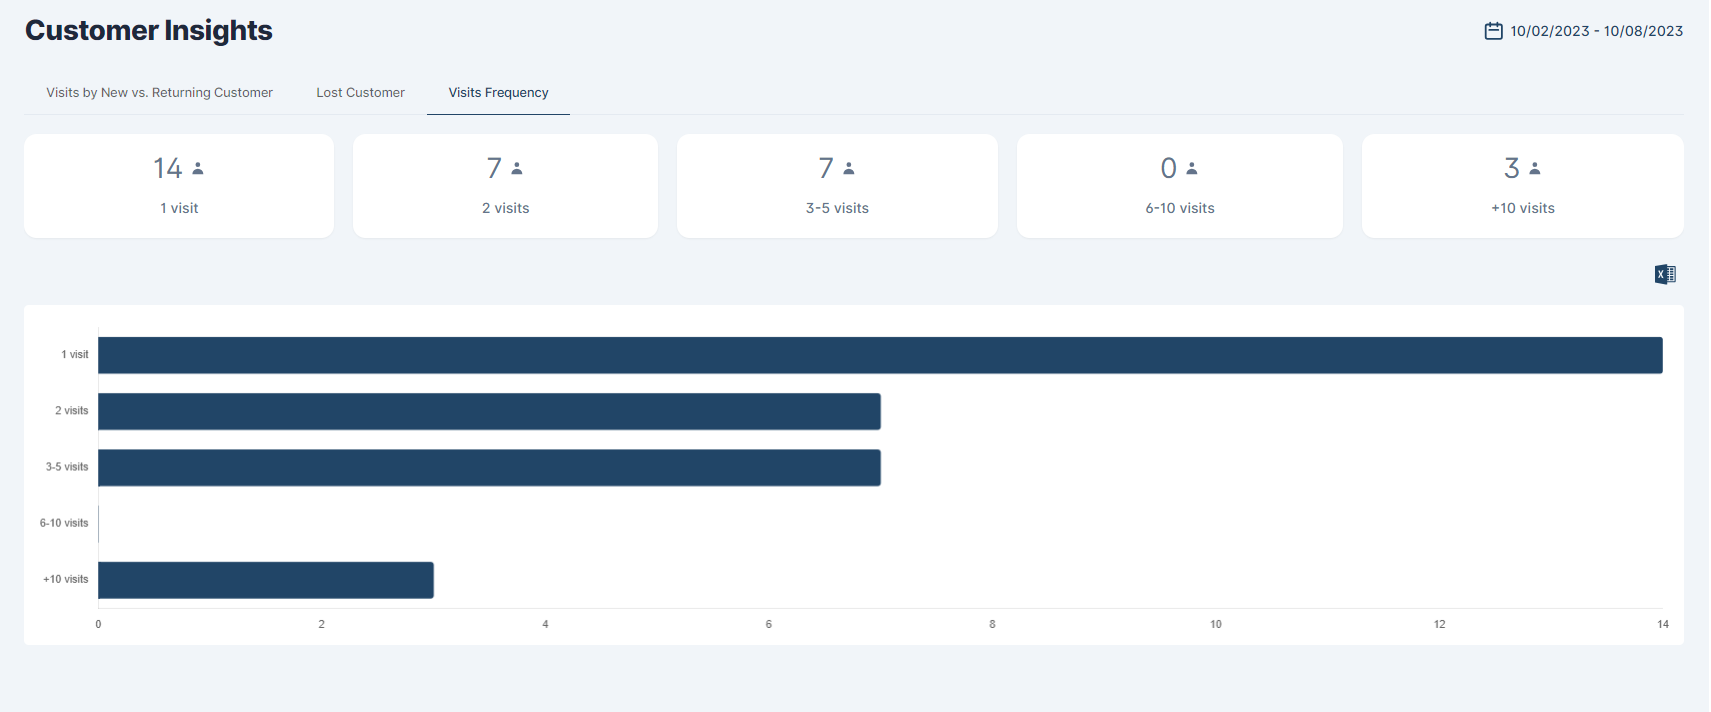
We can also export chart to Excel.
❓️ Open Questions
| Question | Answer |
|---|---|
| How might we make users more aware of this feature? | We’ll announce the feature with a blog post and a presentation |
Currently, in the Customer Directory page, the ticket amount is displayed without custom fees, while in the Customer’s Activity page, the amount includes custom fees. How should the ticket amount be displayed consistently?! We use the formula “((Total Tips / Lifetime Spend) / Total Visits) 100*” to calculate the average tip. Is this formula reasonable? |
⚠️ Out of Scope
List the features discussed which are out of scope or might be revisited in a later release.