
Home
Reports Dashboard - Home
| Target release | 01/07/2022 |
| Document status | DRAFT |
| Document owner | [email protected], ([email protected] update) |
| Developer | [email protected], [email protected], [email protected], [email protected] |
| QA | [email protected], [email protected] |
🎯 Objective
| Objective |
|---|
| Simplify the user experience |
| Include only the most important and relevant information |
| Should be generated automatically and updated in real-time |
| Should include key performance metrics, such as revenue, expenses, sales to provide a comprehensive view of the business’s performance |
🤔 Assumptions
A restaurant manager may check POS data to check the daily revenue, with Reports Dashboard it would be much more easier to check daily revenue with a mobile phone at anytime, anywhere.
🌟 Milestones
Create a visual road-map and help your team stay on track. 1. Default loading Sales Summary on website 2. If store don’t use POS –> default loading Gift Card on web and Summary for POS Express on app Blogic view
🗒️ Requirements
| Requirement | User Story |
|---|---|
| Must be mobile responsive | John is the business’s owner, he want to check on his business while taking a vacation |
| Can filter by date | View reports by specific time range |
| Can export reports to excel | Export snapshot reports to excel file, to view later, analytic or send via email |
| Can compare with previous period | John want to compare this Tuesday revenue with the Tuesday on last week |
⚡ API Integration
| Description | API |
|---|---|
| Section: Day of week chart | SaleSummaryChartRequest |
| Section: Time of day chart | SaleSummaryChartRequest |
| Section: At a glance | ComparisonRequest |
| Section: Sales summary | QuickReportRequest |
| Section: Tender types | SaleSummaryPaymentsRequest |
| Section: Sale types | GetSaleTypesReportRequest |
| Section: Top selling | TopSaleCategoryRequest |
| Section: Cancelled, Comp, Void | QuickReportRequest |
| Export excel | ExportSaleSummaryRequest |
🎨 User interaction and design
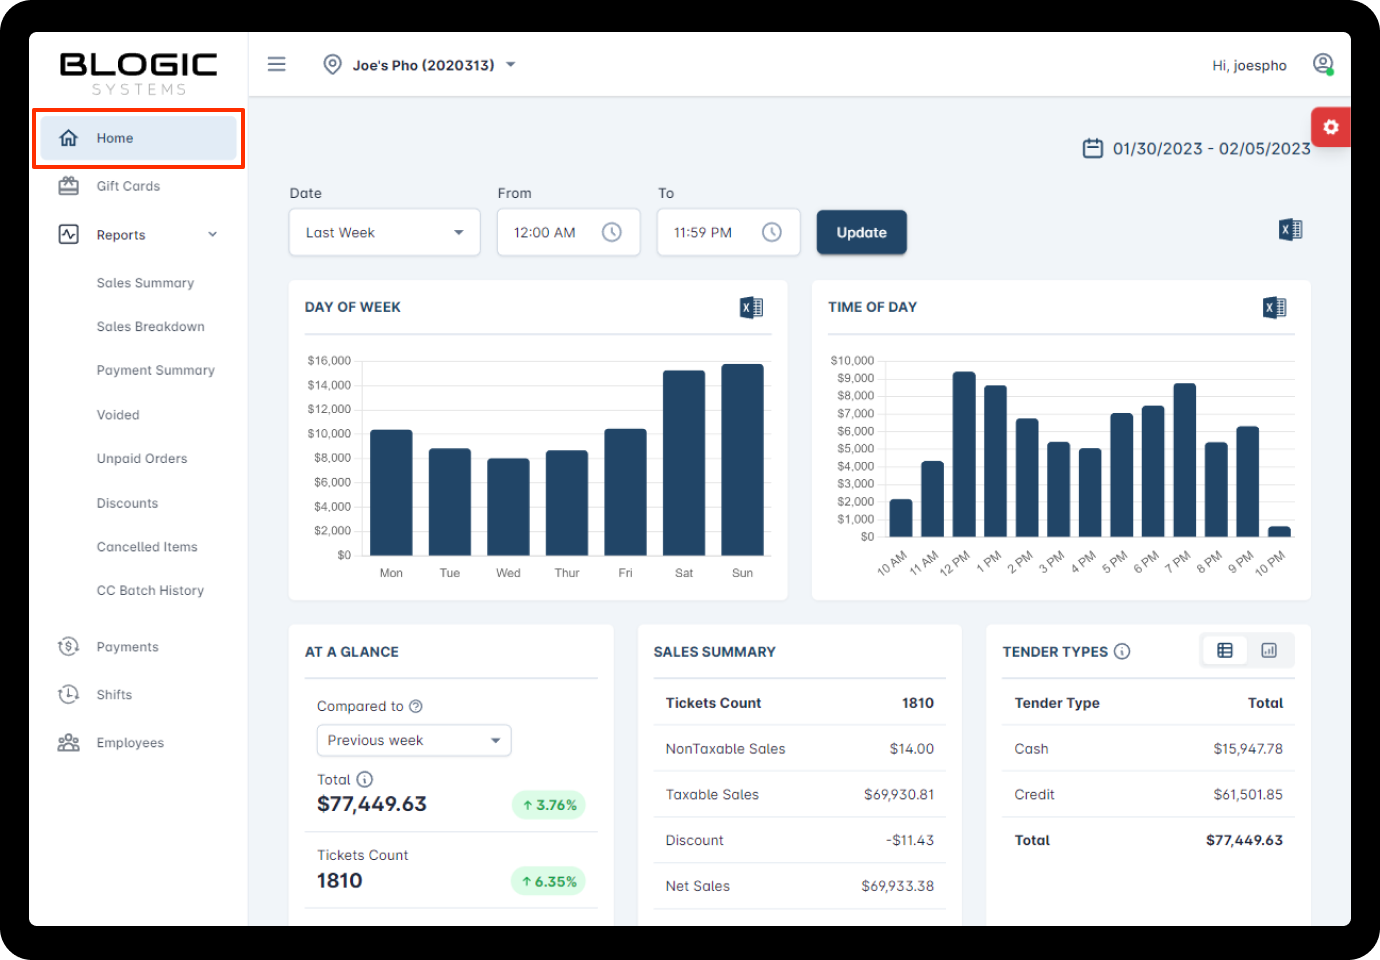
To access Home reports, go to Home on the side menu bar The page is real-time update whenever a transaction is successful or an update which impacted to data related to this page.
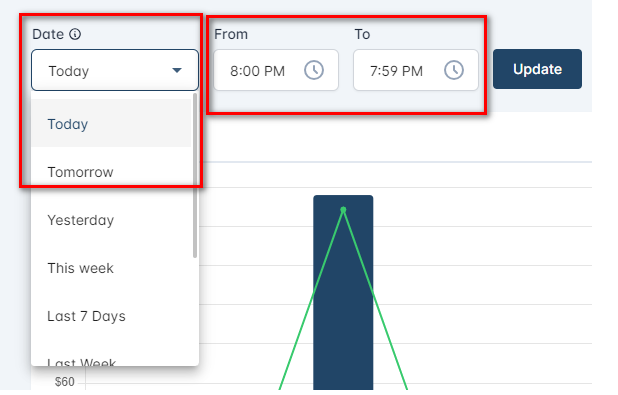
💡 Use the date filter to quickly switch between different time frames and compare data trends, helping to identify areas for improvement and opportunities for growth. {.is-info}Date filter: - Set Defining Start/End of “Today” report is Yesterday 08:00:00 PM for start time: + Then end date will auto calculate plus 24 hours, and in the report, it will have default setting: Today From 08:00:00 PM To 07:59:00 PM. (no matter what setting in end time row in Pos dashboard) + In the Date combobox, Date “Tommorrow” will be showed with this setting. - From & To always display as setting start time and end time + 24 hours for all Date options. + This logic is applied for all reports in Web Report.
[New Logic from 17-Apr] Change “To date” Today report thành giờ đang search hiện tại (Mục đích để Compare report đúng thời điểm đang kiểm tra, tránh search như logic cũ lại show full ngày, trong khi lúc search chỉ là buổi sáng)
- Tùy setting time từ BO mà có các TH bên dưới
- Thời điểm search sau giờ From date & trước giờ To date trong setting BO
- Nếu chọn Today, Tomorrow, This week, This month, Last 7 days => FROM là time theo BO & TO date show giờ phút đang search
- Nếu chọn Yesterday, Last week, Last month => FROM là time theo BO & To date show giờ theo setting BO
- Thời gian search sau giờ From date & sau giờ To date trong setting BO => Ngoài khoảng From To
- Nếu chọn Today, Tomorrow, This week, This month, Last 7 days, Yesterday, Last week, Last month => From & To date show giờ theo setting BO
- Thời điểm search trước giờ From date
- Nếu chọn Today, Tomorrow, This week, This month, Last 7 days, Yesterday, Last week, Last month => From & To date show giờ theo setting BO
- Thời điểm search sau giờ From date & trước giờ To date trong setting BO
- Nếu Date type là Custom Date thì Compared To ở bảng At A Glance đều chuyển thành Last Range
(Custom Date là khi lựa chọn time khác với time setting từ BO/Business Configuration/Defind “Today” button in Reports)
Ví dụ:
Today From 12:00 AM, To 11:59 PM
Time search là 11:00 AM, chọn Today => TO date show 11:00 AM (thay vì logic cũ show 11:59 PM như settings trong BO)
From Today 12:00 PM, To Tomorrow 11:59 AM
Time search là 11:00 AM, chọn Today => Báo lỗi vì End date sớm hơn Start date, trường hợp này sẽ set To date = To date trong setting BO
Nếu chọn Yesterday => To date là ngày hôm nay, vì vậy sẽ lấy đến giờ hiện tại (giờ đang search)
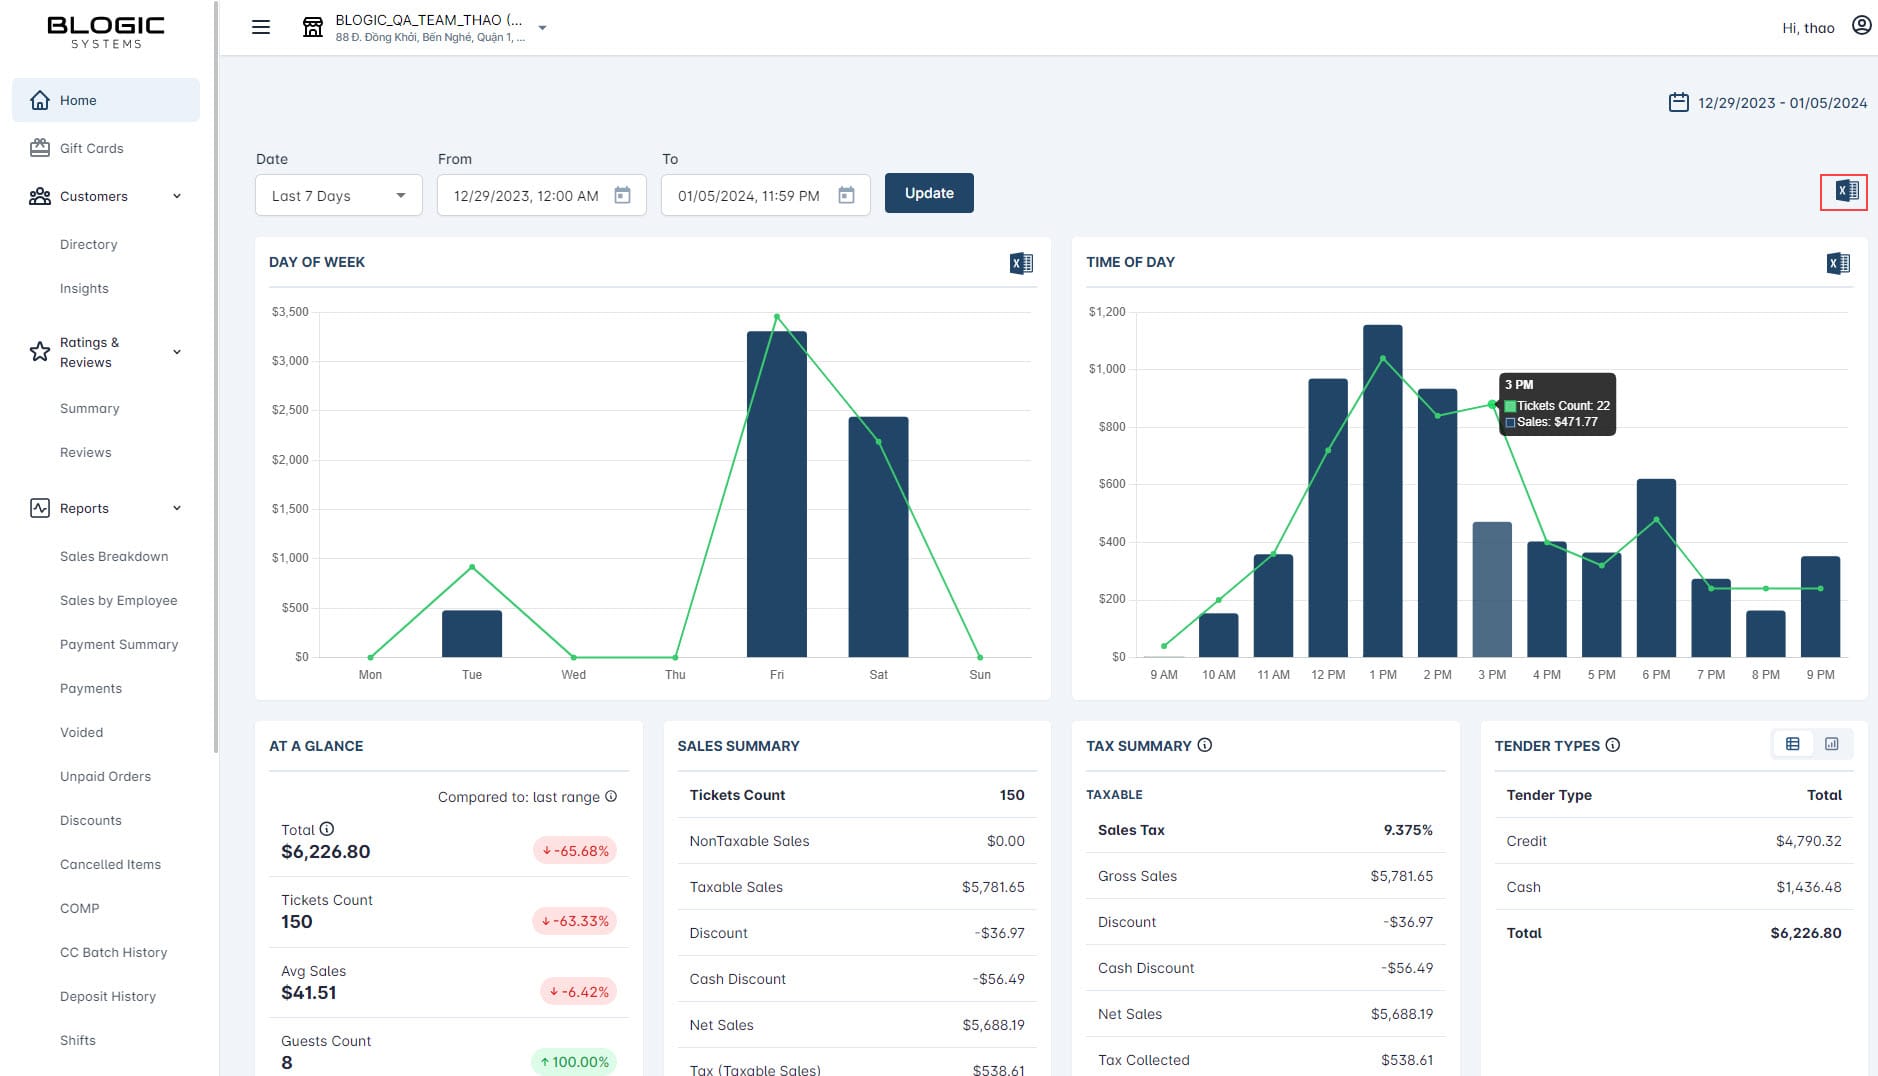
✨ Uncover revenue growth insights with charts
Day of week chart
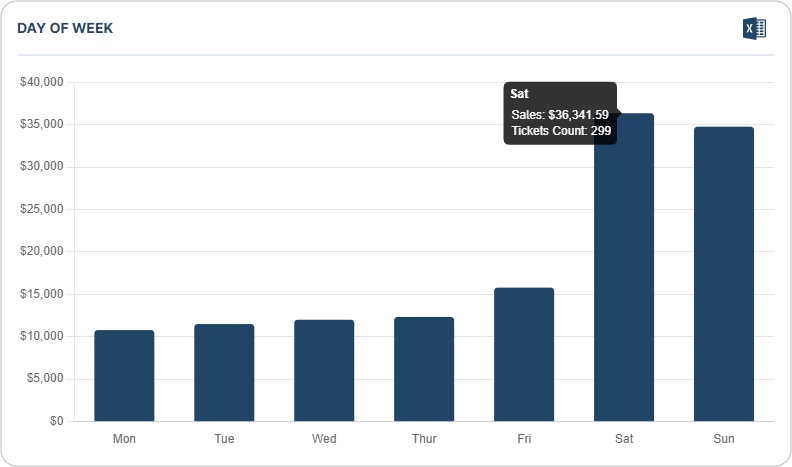
The revenue chart by day of week is a bar chart, each bar represents the revenue on a particular day.
It displays the revenue over a set period of time such as a week, a month.
For example, if you set the date filter to view last month data, the monday bar will represent for total revenue of every monday in last month.
By comparing revenue by day of the week, you can make adjustments to improve their overall financial performance.
Ticket showed in chart: ticket which status is FIN or RET
Time of day chart
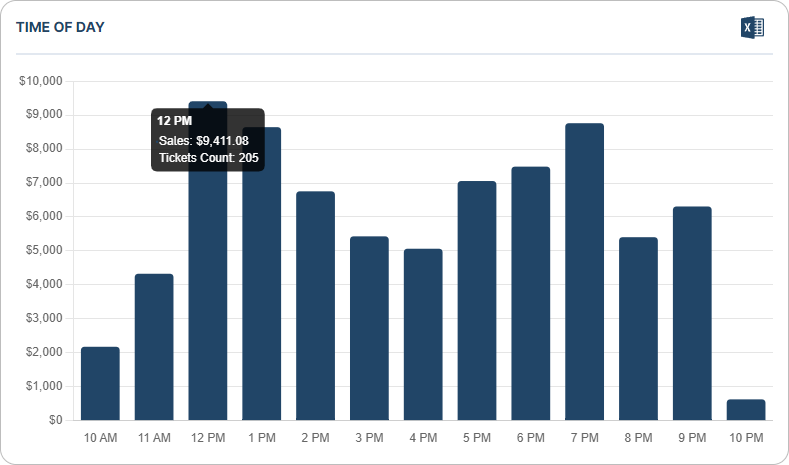
The revenue chart by time of day is similar to the chart by day of week.
It displays the revenue at different times of the day. It is useful for understanding the patterns and trends in a business’s revenue, such as the busiest times of the day and the slowest times. This information can help businesses make informed decisions about staffing levels, promotions, and other factors that may impact revenue.
Ticket showed in chart: ticket which status is FIN or RET
✨ Total revenue at a glance
!
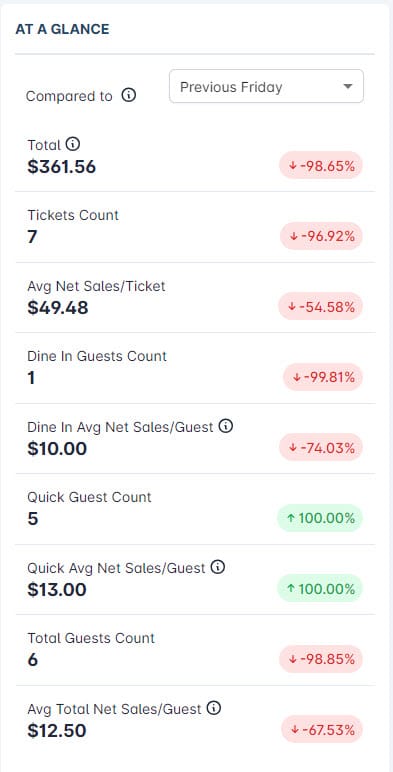
Snapshot and calculate total revenue (tax included), tickets count may help you understand your performance relative to your goals and expectations. + Total:= (Net Sales + Tax) tính tổng tất cả các sales type đã FIN - không đếm ticket thanh toán 1 phần, Pre-Auth + Ticket count: count all ticket đã thanh toán from/ to (KO đếm những ticket Re-Auth & thanh toán 1 phần) + Avg Net Sales / Ticket: Total Net Sales / Tickets Count (bao gồm cả ticket thanh toán ACC & Otter) + Dine In Guests Count: đếm số lượng guest có sales type = Dine in + Dine In Avg Net Sales/Guest: Avg Net sales (ACC Receiveable included - if any) / số lượng ticket có sales type = Dine In và có guest + Quick Guests Count: đếm số lượng guest có sales type khác Dine in & Guest Number >0 + Quick Avg Net Sales/Guest: Avg Net sales (ACC Receiveable included - if any) / số lượng ticket có sales type khác Dine In và có guest (bao gồm những ticket ACC + Otter + Web order + Order online + Phone app + kiosk) + Total Guests Count: Total Net Sales / Total guest Count + Avg Total Net Sales / Guest: Net sales are only calculated for tickets with guests/ Total guest count - chỉ tính Net sales những ticket có number of guest > 0 By comparing total revenue with a previous period, you can gain valuable insights into the factors that may be affecting your sales and revenue, such as changes in consumer demand, market conditions, or competition.
Guests Count: count guest from ordered table in store and with successful transaction (order and payment successfully, refund)
Avg Sale/Guest Count: Total Sale/Total Guests Count
💡Average Saleis simply calculated byTotal / Tickets Count. {.is-info}
💡 Click on the Compared to form to select another period to compare with. {.is-info}✨ Sale summary section
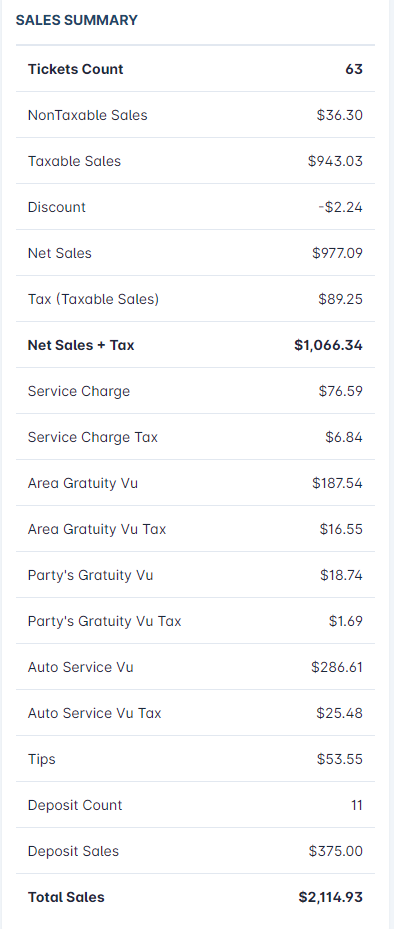
Sale summary report is used to provide an overview of your business’s sales performance. It provides a summary of key metrics related to sales, such as tickets count, net sales, taxes, tips, discounts, total sales.
Row Net Sales + Tax must be equal to Total in At a glance section.
Deposit Count & Deposit Sale also appear in the report, it appeared when a Deposit Item is issued. Deposit Sale = Total Deposit Item issued (not care about tax whether it is set Sale Tax or VAT).
Ở Ticket count: Không tính ticket issue giftcard > 💡 This section is similar to Summary section of Sale Summary Report in POS Dashboard. {.is-info}
✨ Tender types section
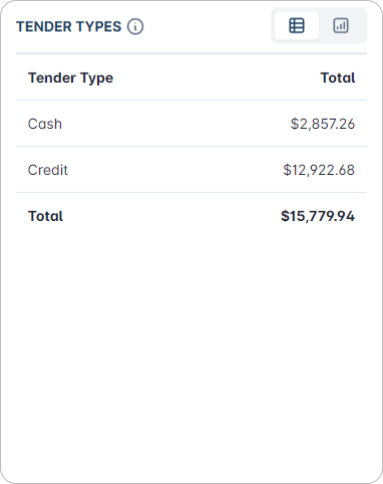
** Khi thực hiện Pre-Auth payment thì được ghi nhận lên đây (page sẽ reload), khi cancel Pre-Authen thì page cũng được reload lại và update new data.
Provides a breakdown of the different payment methods used by customers. Tender types can include cash, credit card or other forms of payments.
By tracking sales by tender types, you can gain insight into the costs associated with different payment methods, such as credit card processing fees, which can impact your business’s profitability.
Row Total must be equal to Total in At a glance section (Updated by H.An: only sum ticket finished not partial payment).
💡 This section is similar toPayment Typesection ofSale Summary Reportin POS Dashboard. {.is-info}
✨ Sale types section
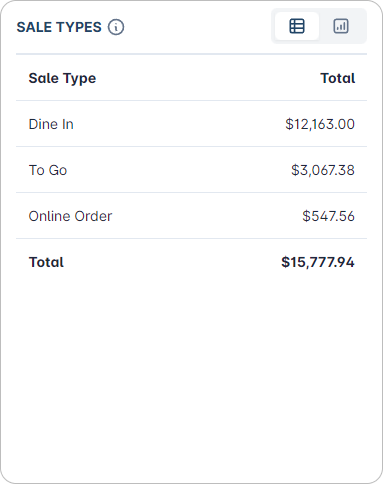
Provides a breakdown of the different types of sales. Sale types can include dine in (in-store sales), to go (take away sales), online ordering, or other types of transactions.
By tracking sales by sale types, you can identify which channels are driving the most revenue and make changes to your sales strategies accordingly.
Row Total must be equal to Total in At a glance section.
💡 This section is similar toSale Typesection ofSale Summary Reportin POS Dashboard. {.is-info}
✨ Top selling section => Change to TOP CATEGORIES
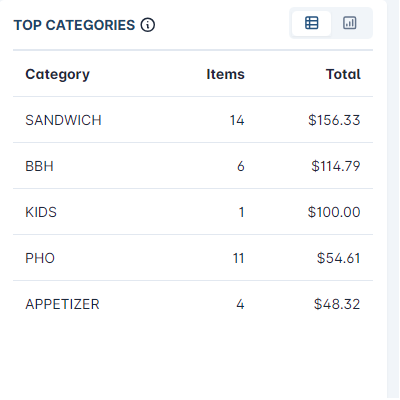
- Total: show the total Net Sales + Tax
- Sorting the list is DESC.
Top categories section displays top 5 best-selling categories. This report is generated based on the total revenue generated by each item. Do not show category which has Qty/Total = 0, Qty/Total < 0 can be showed in case refund ticket.
By tracking the top selling items, you can identify trends and consumer preferences, and make decisions about which items to stock more of or discontinue.
User can also view the trend by chart
✨ TOP ITEMS
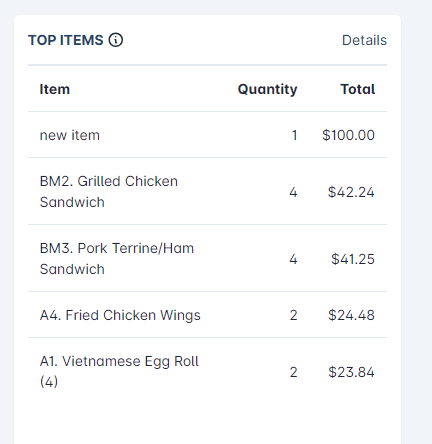
- Show top 5 best-selling items, do not show item which has Items = 0, Items < 0 can be showed in case refund ticket. - Sorting the list is DESC. - Total: show the total Net Sales + Tax. - View detail all item in Details.
💡 This section is similar to Best & Worst Sold Item Report in POS Dashboard. {.is-info}✨ Cancelled - Voided - Comp section
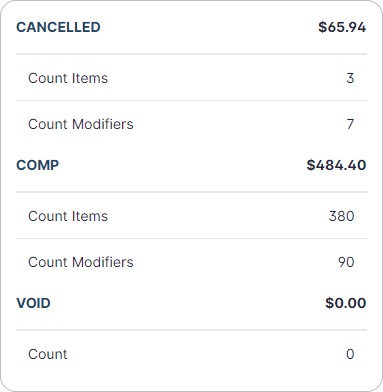
This section displays total amount, items and modifiers was cancelled or comp.
By tracking cancelled or voided transactions, you can identify any issues with your sales process, such as technical glitches or customer dissatisfaction, and take steps to resolve them.
COMP: Show Net Sales
VOID: File 0-4: Show số đã trừ Cash Discount nếu pay bằng Cash & không bao gồm Tip File 4-0: Show số total pay bằng Cash & không bao gồm Tip File 4-4: Show số đã trừ Cash Discount nếu pay bằng Cash & không bao gồm Tip
💡 This section is similar toCancelled,Voided,Compsections ofSale Summary Reportin POS Dashboard. {.is-info}
✨ Cash Summary
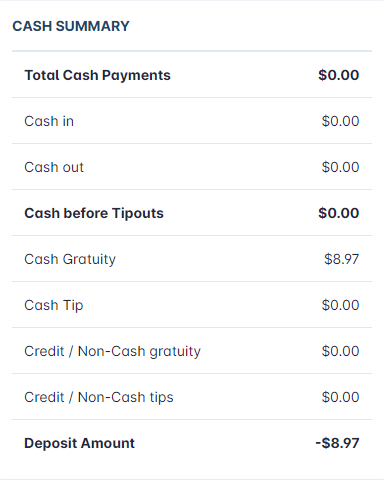
- Total Cash Payments: show total amount including tax, service charges including tax, total tip
- Cash in/Cash out: show the amount of cash in/cash out when added in POS/Cash In/Out
- Cash before Tipouts: = Total Cash Payments + Cash in - Cash out
- Cash Gratuity: Total service charges not including service charge tax when payment by Cash
- Cash Tip: Total tip when payment by Cash (refer Total service charge in POS Dashboard/REPORTS/Sale Summary/Tips by Payment Type)
- Credit/Non-Cash gratuity: Total Service charges not including service charge tax (refer Total service charge in POS Dashboard/REPORTS/Sale Summary)
- Credit/Non-Cash tips: Tips charged by credit card. (refer Total service charge in POS Dashboard/REPORTS/Sale Summary/Tips by Payment Type) & Not including Custom fee
- Deposit Amount: = Cash before Tipouts - Cash Gratuity - Cash Tip - Credit/Non-Cash gratuity - Credit/Non-Cash tips.
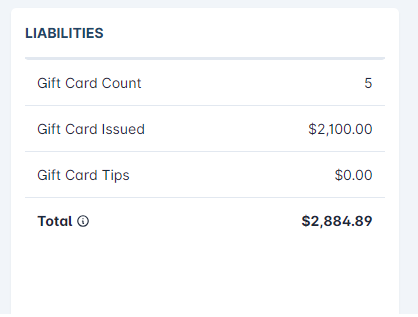
✨ LIABILITIES
Display this column when Gift card is issued or tip charged by Gift card - Gift Card Count: Total gift card - Gift Card Issued: Total amount added to gift card - Gift Card Tips: Tip charged by Gift Card - Total = Total Sales + Gift Card Issued + Gift Card Tips p/s: Để add Tips cho Gift Card: Tạo 1 transaction issue GC bằng Credit card rồi vào màn hình Batch Manager để adjust tip
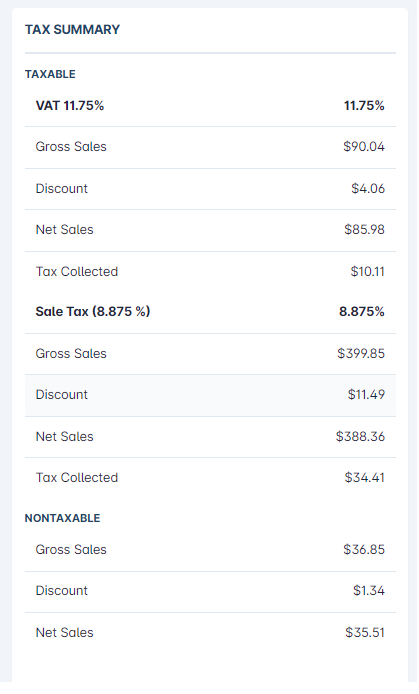
✨ TAX SUMMARY
Display as in Sale Tax section of Sales Summary Report in POS Dashboard - Add Net Sales item in TAXABLE section whether Discount item appeared or not.
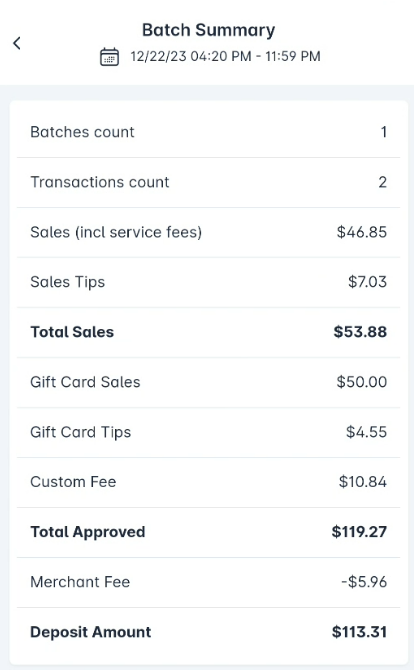
✨ BATCH SUMMARY
Display as in Credit Card Batch History in POS Dashboard Sau khi Settle thì mới show ra dữ liệu [22-Dec-23] cập nhật lại UI hiển thị bảng Batch Summary để show được các dòng về GC khi batch đó có GC issue & GC Tip
✨ Export Excel Summary Report
To export Sale Summary Report to excel, hit the excel icon on the top-right corner.
It will automatically generate multi-section reports and save to your computer as an excel file. - Deposit Item is separated from Sales Summary table in “Summary” Sheet. - In other tables, Deposit Item is not included in. (applied in Summary, Hourly Breakdown and Weekday Breakdown sheet)
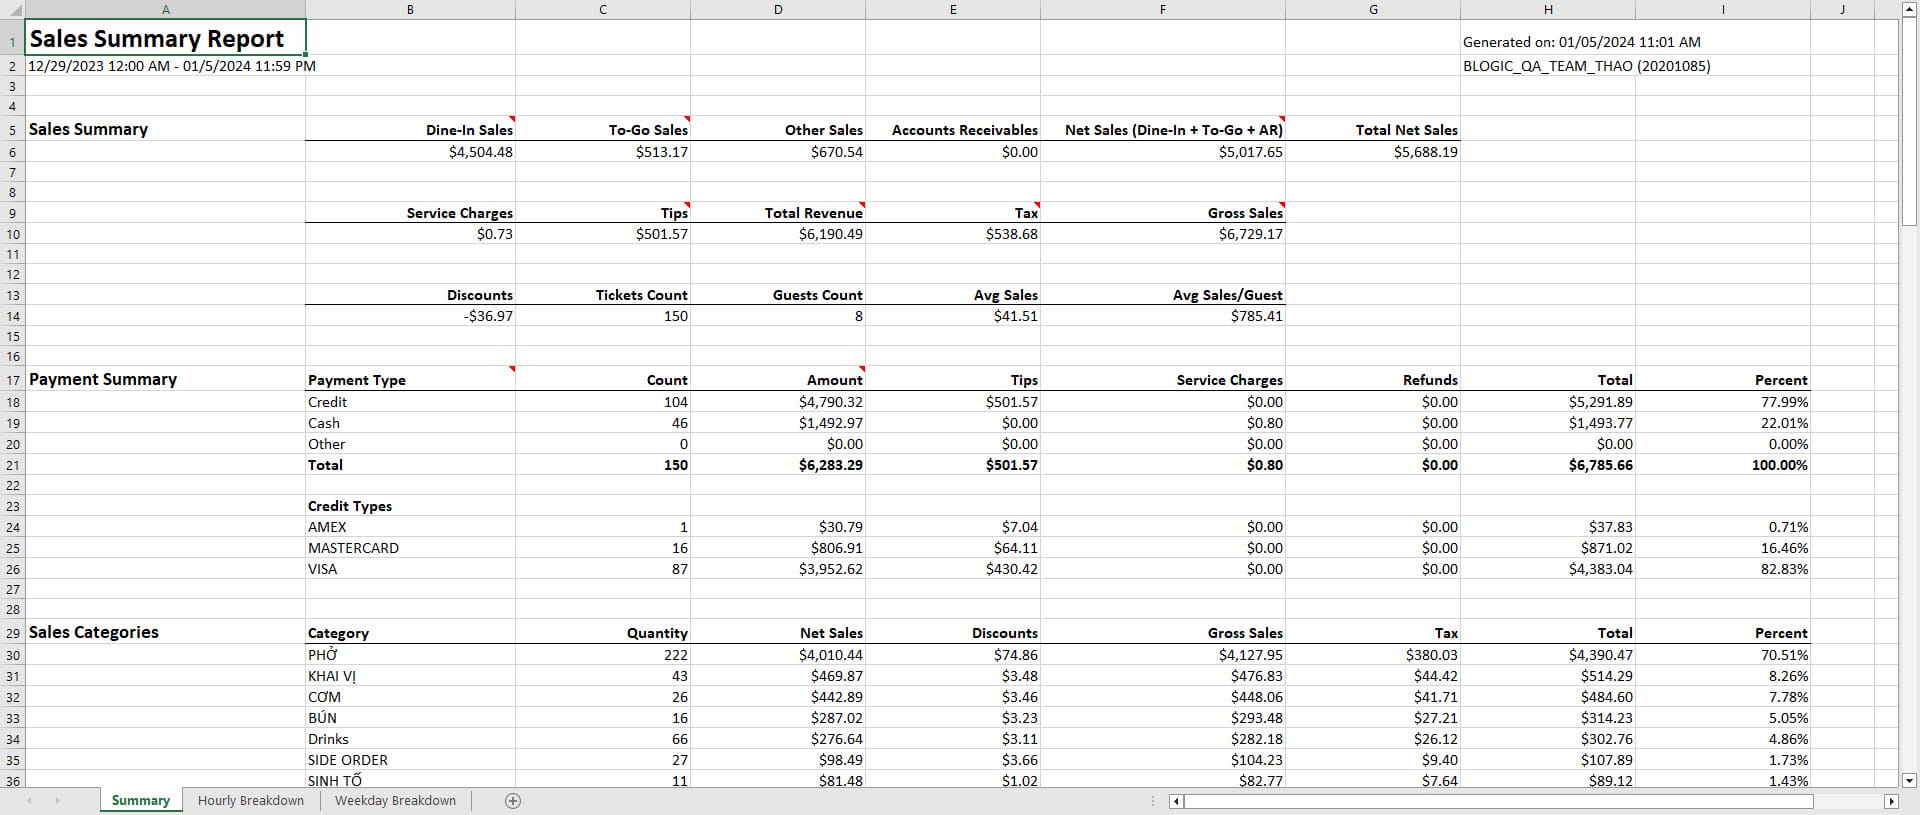
1. SALES SUMMARY: (Taxes and service charges not included) + Dine-In: chỉ get Net sales có Sales type Full Service/ Dine In + To go: chỉ get Net sales có Sales type to go + Other Sales: get all sales type different Dine in / Togo + Accounts Receivables: get sales type payment Account Receivable
[7-Jun-2024] Release Daypart Breakdown in Excel file
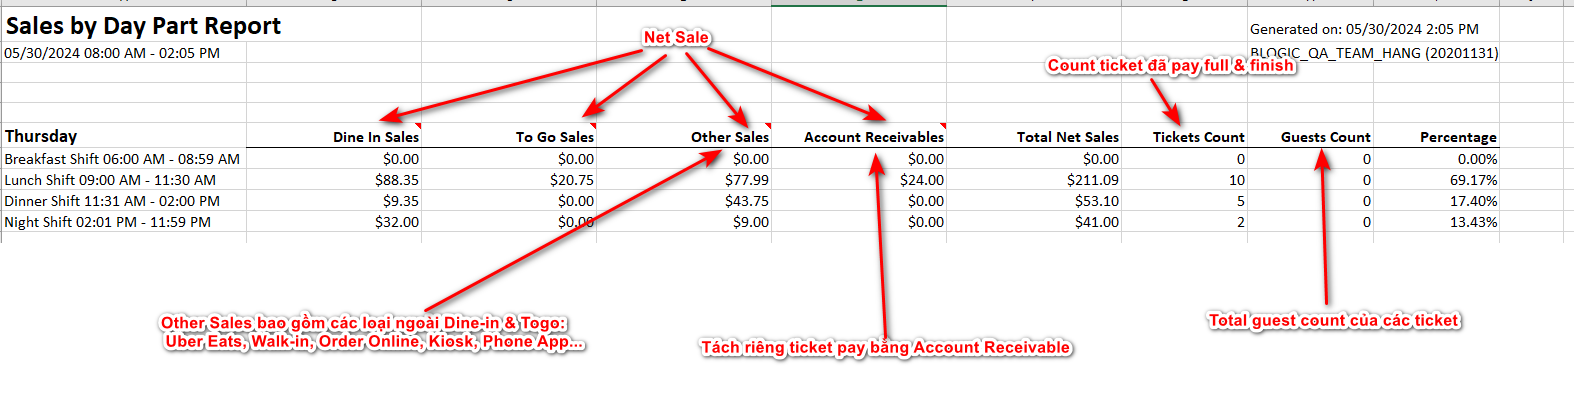
- Trong file Excel, phần Item Type by Daypart sẽ lấy theo config setting custom time từ BO/Sales Summary
- Nếu tiệm chưa có config custom time, sẽ không show trong report
- Nếu tiệm chưa có config custom time, sẽ không show trong report
- Trong file Excel, tạo thêm 1 sheet về Daypart Breakdown, show detail 7 ngày trong tuần và các custom time theo BO
- Nếu tiệm chưa có config custom time, không xuất hiện sheet [Daypart Breakdown]
- Nếu tiệm chưa có config custom time, không xuất hiện sheet [Daypart Breakdown]
- Các cột Net Sale show số sau Discount
❓️ Open Questions
| Question | Answer |
|---|---|
| How might we make users more aware of this feature? | We’ll announce the feature with a blog post and a presentation |
⚠️ Out of Scope
List the features discussed which are out of scope or might be revisited in a later release.