Sales Summary
Last updated on
| Target release | 01/07/2022 |
| Document status | DRAFT |
| Document owner | [email protected] |
| Developer | [email protected], [email protected], [email protected], [email protected] |
| QA | [email protected] |
🎯 Objective
Provide context on this project and explain how it fits into your organization’s strategic goals.
| Objective |
|---|
| Simplify the user experience |
🤔 Assumptions
List any assumptions you have about your users, technical constraints, or business goals.
🌟 Milestones
Create a visual road-map and help your team stay on track.
🗒️ Requirements
| Requirement | User Story |
|---|---|
| Must be mobile responsive | John is a PM who wants to check on his team’s progress from the train station |
⚡ API Integration
| Description | API |
|---|---|
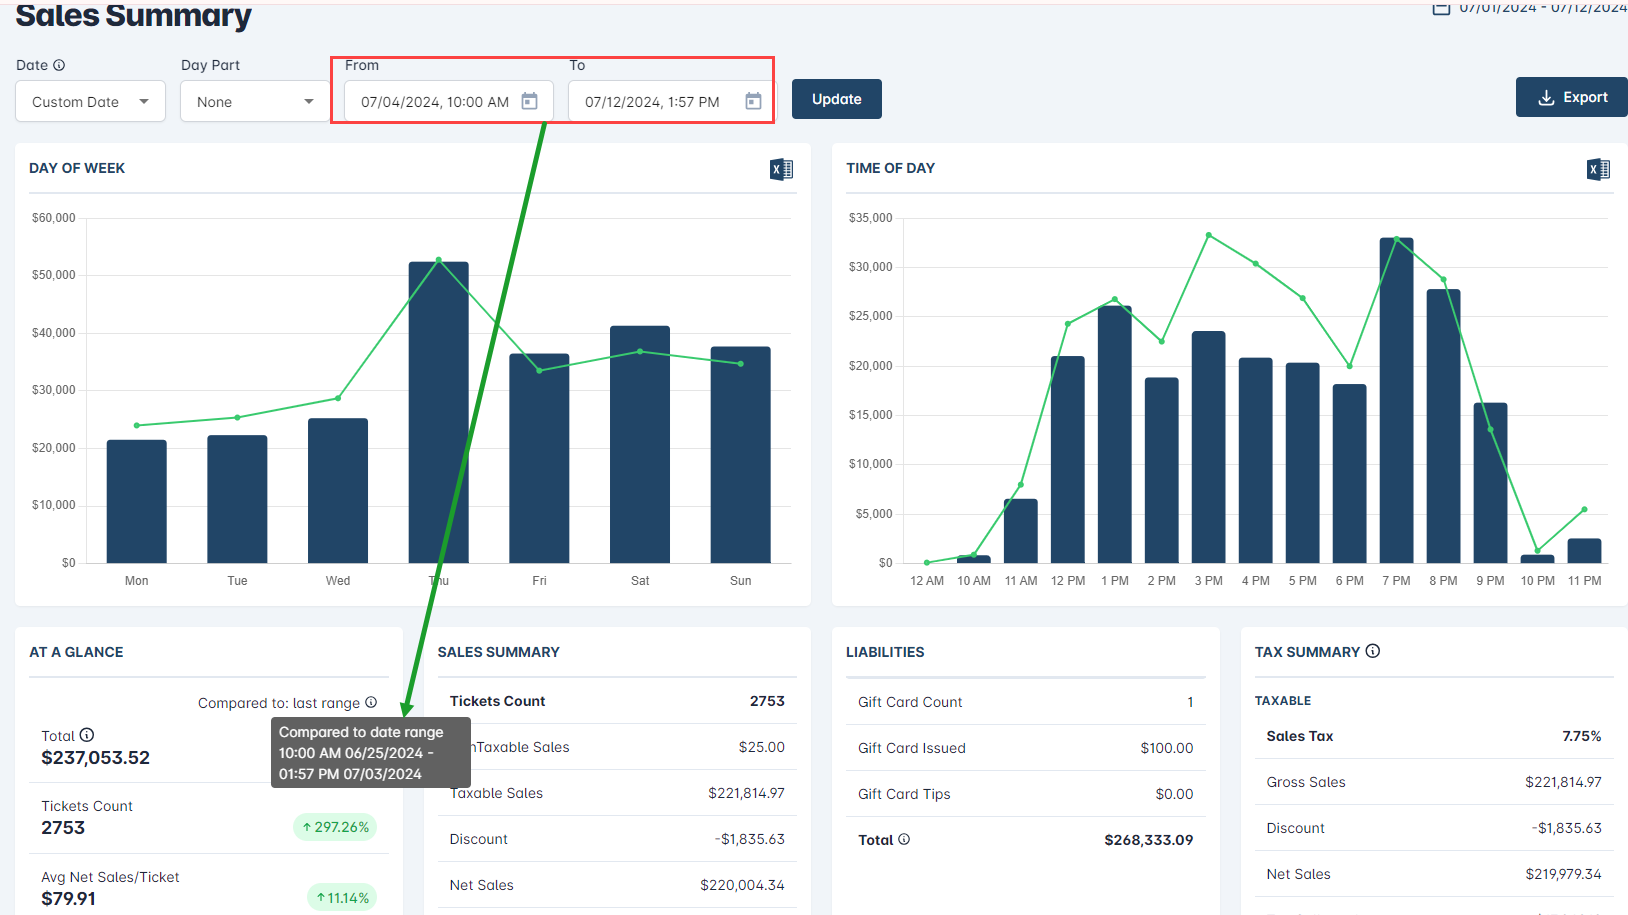
| Section: Day of week chart | SaleSummaryChartRequest |
| Section: Time of day chart | SaleSummaryChartRequest |
| Section: At a glance | ComparisonRequest |
| Section: Sales summary | QuickReportRequest |
| Section: Tender types | SaleSummaryPaymentsRequest |
| Section: Sale types | GetSaleTypesReportRequest |
| Section: Top selling | TopSaleCategoryRequest |
| Section: Cancelled, Comp, Void | QuickReportRequest |
| Request list of employees | GetEmployeesRequest |
🎨 User interaction and design
At a Glance
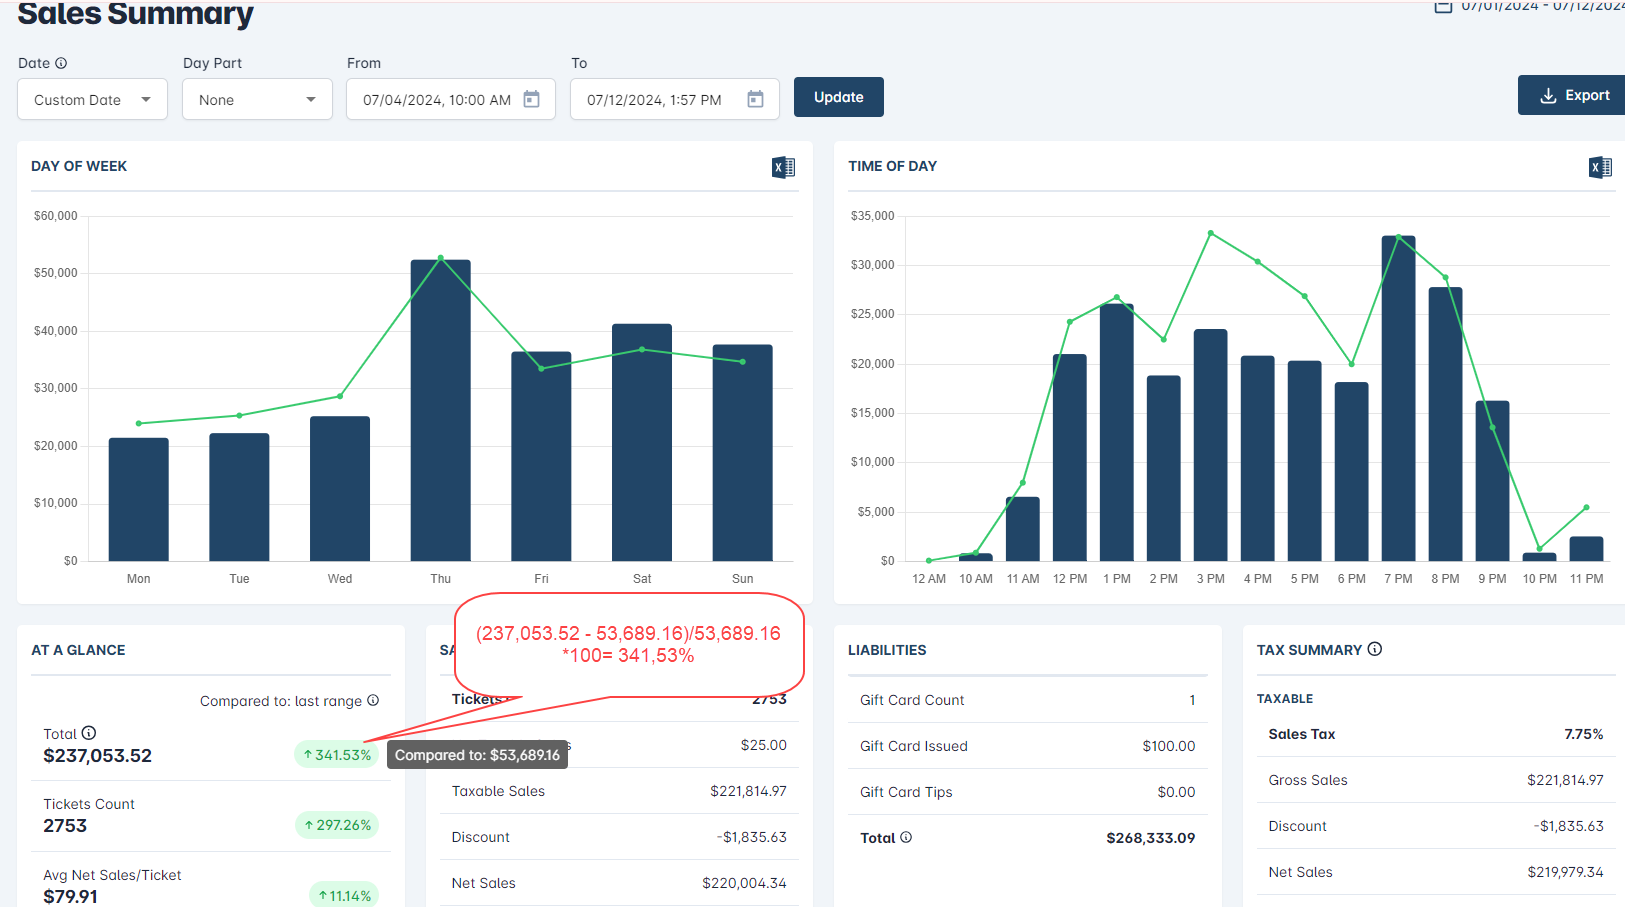
- Total sales = Net sales + tax
Percent = (Total sales (from/to search) - total sales compare) / Total sales compare *100


## ❓️ Open Questions
| Question | Answer |
|---|---|
| How might we make users more aware of this feature? | We’ll announce the feature with a blog post and a presentation |
⚠️ Out of Scope
List the features discussed which are out of scope or might be revisited in a later release.
